Improving histogram-based image contrast enhancement using gray-level information histogram with application to X-ray images
基于灰度信息直方图的X射线图像对比度增强改进
Keywords:Image enhancement,Gray-level information histogram,Histogram equalization,X-ray image
关键词:图像增强,灰度信息直方图,直方图均衡化,X射线图像
A B S T R A C T
Many applications of histogram-based techniques for the purposes of image enhancement are well known. However, these techniques often fail to produce satisfactory results for a broad variety of low-contrast images (e.g., X-ray images). In this paper, we propose a new form of histogram for image contrast enhancement. The input image is first divided into several equal-sized regions according to the intensities of gradients, their corresponding statistical values of gray levels are then modified respectively, and finally the processed histogram for the whole image is obtained by the summation of all the weighted values of regions. The fundamental characteristic of this new form of histogram is that the amplitudes of its components can objectively reflect the contribution of the gray levels to the representation of image information. Accordingly, this new histogram is called gray-level information histogram. The performance of many histogram-based enhancement techniques might be improved dramatically using the proposed histogram. Testing on the X-ray images validates the effectiveness of the new histogram.
用于图像增强目的的基于直方图的技术的许多应用是众所周知的。然而,这些技术对于各种低对比度图像(例如,X射线图像)通常不能产生令人满意的结果。在本文中,我们提出了一种新的图像对比度增强直方图。首先根据梯度强度将输入图像分成几个相同大小的区域,然后分别修改相应的灰度统计值,最后通过所有加权值的总和得到整幅图像的处理直方图的地区。这种新的直方图形式的基本特征是其分量的幅度可以客观地反映灰度级对图像信息表示的贡献。因此,这个新的直方图被称为灰度信息直方图。使用所提出的直方图可以显着改善许多基于直方图的增强技术的性能。在X射线图像上进行测试可验证新直方图的有效性。
1 Introduction
X-ray images play a very important role in helping physicians make their diagnostic decision for treatment. However, the X-ray image quality is not always good because X-ray quantity radiated to the patient is limited considering patient safety. Image enhancement is a desired solution to that problem. Image enhancement techniques can be used to improve the visual appearance of an image, or to convert an image to a form better suited to the subsequent processing, such as segmentation, feature extraction,detection, and recognition. Thus, a considerable amount of research has focused on this subject and numerous enhancement techniques have been developed [1-6]. One of the most popular methods for image contrast enhancement is Global Histogram equalization ( GHE), which
attempts to alter the gray-level histogram of an image to closely match a uniform distribution. Although the GHE method is simple and fast, its performance is not good enough in many cases due to its intrinsic limitations, such as the mean-shift problem ( i.e.,the mean brightness of the output image is significantly different from the input image) and relatively low enhancement power.
1 简介
X射线图像在帮助医生对治疗作出诊断决定方面起着非常重要的作用。但是,考虑到病人的安全性,辐射到病人的X射线量是有限的,故X射线图像质量并不总是好。图像增强是解决这个问题的理想方案。图像增强技术可用于改善图像的视觉外观,或将图像转换为更适合后续处理的形式,如分割,特征提取,检测和识别。因此,相当多的研究集中在这个问题上,并且已经开发了许多增强技术[1-6]。图像对比度增强最常用的方法之一是全局直方图均衡(GHE),它试图改变图像的灰度直方图使得与均匀分布紧密匹配。虽然GHE方法简单而快速,但由于其固有的局限性,如均值漂移问题(即输出图像的平均亮度与输入图像明显不同),其性能并不理想,增强功率相对较低。
To overcome the aforementioned drawbacks, many variants of histogram equalization have been proposed [7-24]. In order to preserve the resulting image's brightness, Kim proposed Bright-ness Preserving Bi-Histogram Equalization (BPBHE) [8]. This method first separates the input image's histogram into two subhistograms based on the mean of the input image's brightness and then the two sub-histograms are equalized independently.Later, Chen and Ramli proposed an optimal extension of BPBHE,called Minimum Mean Brightness Error Bi-Histogram Equalization (MMBEBHE) [9]. This method separates the histogram using the threshold that would yield minimum brightness difference between the input image and the output image. Other solutions can be found in [10-13].
为了克服上述缺点,已经提出了许多直方图均衡的变体[7-24]。 为了保持最终图像的亮度,Kim提出了亮度保留双直方图均衡(BPBHE)[8]。该方法首先根据输入图像亮度的均值将输入图像的直方图分解为两个子图,然后对这两个子直方图进行独立均衡。之后,Chen和Ramli提出了BPBHE的最优扩展,称为最小平均亮度误差双直方图均衡化(MMBEBHE)[9]。该方法利用阈值分离直方图,使输入图像与输出图像之间的亮度差最小。其他解决方案可以在[10-13]中找到。
In some cases (e.g., medical image analysis), local details may bemore important than global contrast [4,5]. For these applications,the global HE method is inadequate because it cannot adapt to local brightness features of the input image due to the global nature of this technique. To overcome this drawback, some local histogram-equalization methods have been developed [4-6,14-19]. A natural extension of GHE technique is the termed adaptive histogram equalization (AHE), which maps the gray level values of pixels using the relationships obtained from the local histograms[6,14]. Since the AHE method must be conducted throughout all pixels in the entire image, the computational complexity of this technique is very high. This time-consuming procedure was improved by Pizer et al. with their contrast limited adaptive histogram equalization (CLAHE) [15]. It first divides the input image into blocks, and then calculates the mapping functions of those blocks. For each pixel, the mapping function is obtained by interpolating four mapping functions of the nearest blocks. In CLAHE,the amount of contrast is restricted by an adjustable parameter known as the "clipping level". In addition, Jin et al. Proposed Multi-scale adaptive histogram equalization (MAHE) [16]. The input image is first decomposed into sub-bands using wavelet transform. Then the high-frequency sub-band is treated with the adaptive histogram equalization, and finally the processed subband is merged with the low-frequency sub-band to generate the resulting image.
在某些情况下(例如医学图像分析),局部细节可能比全局对比更重要[4,5]。对于这些应用,直方图均衡方法(HE)是不够的,因为由于这种技术的全局性质,它不能适应输入图像的局部亮度特征。为了克服这个缺点,已经开发了一些局部直方图均衡方法[4-6,14-19]。 GHE技术的自然延伸称为自适应直方图均衡(AHE),它使用从局部直方图获得的关系映射像素的灰度值[6,14]。由于AHE方法必须在整个图像的所有像素中进行,因此该技术的计算复杂度非常高。这个耗时的过程由Pizer等人改进。与他们的对比限制自适应直方图均衡(CLAHE)[15]。它首先将输入图像分成块,然后计算这些块的映射函数。对于每个像素,通过内插最近块的四个映射函数来获得映射函数。在CLAHE中,对比度受限于一个称为“限幅级”的可调参数。另外,Jin等人提出了多尺度自适应直方图均衡(MAHE)[16]。首先使用小波变换将输入图像分解成子带。然后用自适应直方图均衡处理高频子带,最后将处理后的子带与低频子带合并以生成结果图像。
The above mentioned histogram-based techniques have been widely used in a number of computer vision applications. However, they still have limitations and cannot handle certain classes of images well, such as X-ray images characterized by the fact that the amplitudes of their histogram components are very high at several gray-level bins corresponding to the large area background in these images. If using GHE technique, the resulting image will have washed-out appearance. This undesirable appearance also exists in the results of BPBHE and MMBEBHE, as they still implement the HE operation in each grayscale segment. Local adaptive techniques (e.g., CLAHE) may suffer from noise overenhancement or/and ringing artifacts. The main cause for different types of unsatisfactory results is that the frequency of gray levels in standard histogram is usually not consistent with their contributions to the representation of the image details. Note that most of histogram-based techniques rely on the basic principle that the dynamic range of gray levels is modified according to the probability distribution of gray levels in the entire image or local blocks. Fig. 1 is a simple example illustrating the aforementioned shortcoming of the standard histogram. Its histogram, as shown in Fig. 1(b), contains only two components. It is obvious that the frequency of the white gray level is quite larger than that of the black one. However, from the viewpoint of depicting the image details, the contribution of the black gray level is equivalent to that of the white one because there is no information (i.e., a sandwich) left in the image if we substitute the white gray level for the pixels of the black gray level.
上述基于直方图的技术已被广泛用于许多计算机视觉应用。然而,它们仍然有局限性,并且不能很好地处理某些类型的图像,例如X射线图像,其特征在于其直方图分量的振幅在与这些图像中的大面积背景相对应的几个灰度分箱处非常高。如果使用GHE技术,所得到的图像将具有褪色外观。 BPBHE和MMBEBHE的结果中也存在这种不希望的外观,因为它们仍然在每个灰度段中执行HE操作。局部自适应技术(例如,CLAHE)可能遭受噪声过强或/和振铃伪影。不同类型的不满意结果的主要原因是标准直方图中灰度级的频率通常与它们对图像细节表示的贡献不一致。请注意,大多数基于直方图的技术都依赖于基本原理,即根据整个图像或局部块中灰度级的概率分布修改灰度级的动态范围。图1是说明标准直方图的上述缺点的简单例子。它的直方图,如图1(b)所示,只包含两个分量。很显然,白色灰度级的频率比黑色的频率高很多。然而,从描绘图像细节的角度来看,黑色灰度级的贡献等同于白色灰度级的贡献,因为如果我们用白色灰度级代替图像中的信息(即,三明治)黑色灰度级的像素。
To overcome the drawback of the standard histogram, this paper proposes a new version of histogram named gray-level information histogram, in which the amplitudes of its components are cumulative summations of weighted statistical values of the gray levels in different regions. The motivation for this weighting process is to give different importance to each pixel in terms of its contribution to the representation of the image details. Exper imental results show that applying our new histogram to the histogram-based techniques can significantly enhance detailed regions and produce little noise overenhancement and few ringing artifacts.
The rest of this paper is organized as follows: in Section 2, the algorithm and principle of the gray-level information histogram is described. Section 3 shows the comparison of the results using two different forms of histogram: Standard Histogram and Gray-level Information Histogram. Finally, some concluding remarks are made in Section 4.
为了克服标准直方图的缺点,本文提出了一种新的直方图,即灰度信息直方图,其中各个分量的幅值是不同区域灰度加权统计值的累加和。这个加权过程的动机是对每个像素在其对图像细节表示的贡献方面赋予不同的重要性。实验结果表明,将我们的新直方图应用于基于直方图的技术可以显着增强细节区域,并且产生很少的噪声增强和少量振铃伪影。
本文的其余部分组织如下:在第2节中,描述了灰度信息直方图的算法和原理。第3节显示使用两种不同形式的直方图的结果比较:标准直方图和灰度信息直方图。最后,在第4节中做出一些总结性发言。
2. Gray-level information histogram
It is known that the gradients in the image background are very low and the detailed regions are usually associated with high gradients. In other words, the regions with high gradients contain more
detailed information than those with low gradients. Fig. 2 shows the comparison of the results of treating the X-ray image of two hands by GHE technique with five local histograms of equal-sized regions (i.e., Fig. 2(d), (g), (j), (m), and (p)), which are labeled with white pixels according to their intensities of gradients. Fig. 2(e) is the GHE result using the local histogram of regionl with the lowest gradients. Fig. 2(q) is the GHE result using the histogram of regions with the highest gradients. It is observed that the equalized image of Fig. 2(q) is better than the resulting image of Fig. 2(e), which indicates that the histogram distribution shape of the high-gradient regions is superior to that of the low-gradient regions for the image contrast enhancement. In other words, the histogram components of the high-gradient regions provide more accurate estimation of their contribution to the representation of detailed information than those of the low-gradient regions. This hypothesis has been proved to be correct in many cases (e.g., another test example can be found in Fig. 3). Furthermore, from the segmentation results, it can be seen that the original image, Fig. 2(a), contains a large area of background (i.e., regionl, region2, and most area of region3). The high amplitude of the histogram components corresponding to the large area background greatly limits the contrast-stretching ratio of small-scale image details. Therefore, the GHE result using the global standard histogram (Fig. 2(c)) exhibits washed-out appearante, as shown in Fig. 2(b). To overcome this problem, statistic values of background must be reduced. This can be achieved by suppressing the number of pixels in the regions with low gradients. Based on the above mentioned hypothesis, we developed a new form of histogram which is called gray-level information histogram. In contrast to the standard histogram, it has a different statistical operation. The statistical values of gray levels in different regions are modified according to their gradient magnitudes,and the final processed histogram for the whole image is obtained by summation of all the weighted values of regions.
2.灰度信息直方图
已知图像背景中的梯度非常低,细节区域通常与高梯度相关联。换句话说,比那些低梯度的区域,高梯度区域包含更多详细信息。图2显示了通过GHE技术处理两只手的X射线图像的结果与等大小区域的五个局部直方图(即,图2(d),(g),(j),( m)和(p)),根据它们的梯度强度用白色像素标记。图2(e)是使用区域1的局部直方图的梯度最低的GHE结果。图2(q)是使用具有最高梯度的区域的直方图的GHE结果。据观察,图2(q)的均衡图像优于图2(e)的结果图像,这表明高梯度区域的直方图分布形状优于低梯度区域用于图像对比度增强的区域。换句话说,高梯度区域的直方图分量比低梯度区域的直方图分量更精确地估计它们对详细信息表示的贡献。在许多情况下,这个假设已被证明是正确的(例如,另一个测试例子可以在图3中找到)。此外,根据分割结果,可以看出,原始图像(图2(a))包含大面积的背景(即区域1,区域2和区域3的大部分区域)。对应于大面积背景的直方图分量的高振幅大大地限制了小尺寸图像细节的对比度 - 拉伸比。因此,如图2(b)所示,使用全局标准直方图(图2(c))的GHE结果表现出明显的褪色。为了克服这个问题,必须减少背景的统计值。这可以通过抑制具有低梯度的区域中的像素数量来实现。基于上述假设,我们开发了一种新的直方图形式,称为灰度信息直方图。与标准直方图相比,它具有不同的统计操作。不同区域的灰度值的统计值根据其梯度幅度进行修改,并且通过区域的所有加权值的总和获得整个图像的最终处理直方图。
2.1. Gray-level information histogram
The gray-level information histogram is constructed as follows:
(1) Smooth the image with a Gaussian filter mask to mitigate noise effects. This can be performed at different scales, by varying the size of the filter mask which corresponds to the variance of the Gaussian function.
2.1 灰度信息直方图
灰度信息直方图构造如下:
(1)用高斯滤波器平滑图像以减轻噪声影响。这可以通过改变与高斯函数的方差对应的滤波器掩模的大小在不同的尺度上执行。
Fig. 2. Comparison of the GHE results using different local histograms of regions. (a)low-contract original imagr ,and (c)its corresponding standard histogram. Five regions marked with white pixels: (d) regionl 1, (g) regionl 2, (j) regionl 3, (m) regionl 4, (p) regionl 5,their corresponding local histogram: (h) GHE (m) region4, (p) regions, their corresponding local histograms:(f), (i), (1), (o) (r), and their GHE results: (e), (h), (k), (n) and (q)
图2.使用区域的不同局部直方图比较GHE结果。 (a)低收缩的原始图像,和(c)相应的标准直方图。(d)区域11,(g)区域12,(j)区域13,(m)区域14,(p)区域15,其相应的局部直方图:(h)GHE(m)区域4 (f),(i),(1),(o)(r)和它们的GHE结果:(e),(h),(k),(n) 和(q)
Fig.3. Test example. (a) Original Lena image, (h) result of GHE using local histogram of regionl and (c) result of GHE using local histogram of regions
图3.测试实例:(A)原始的Lena图像,(H)用区域的局部直方图表示的结果,(C)用区域的局部直方图表示的结果。
(2) Calculate the gradient magnitude at each pixel using equations similar to the Sobel edge detector. A 3 x 3 pixel gradient operator is described by the pixel numbering convention of Fig. 4.The square root gradient is defined as:
(2)使用与Sobel边缘检测器相似的方程计算每个像素处的梯度幅度。一个3×3像素梯度算子由图4的像素编号惯例描述。平方根梯度定义为:
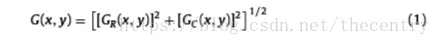
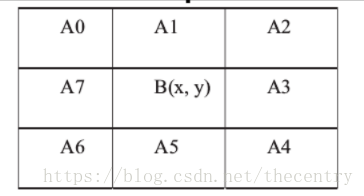
Fig.4. Numbering convention for gradient calculation
图4.梯度计算的编号惯例
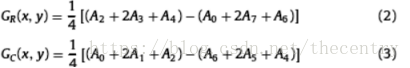
where and are the row gradient and the column gradient at respectively:
其中和分别是处的行梯度和列梯度:
(3) Divide the original image into a proper number of equal-sized regions (i.e., default five regions), according to ascending order of their intensities of gradients. Fig. 2 shows an example of this segmentation operation. Each pixel location in the original image has a specific statistical weighting coefficient depending on its gradient magnitude. The coefficients are determined as
follows:
(3)根据梯度强度的升序,将原始图像分成适当数量的相同大小的区域(即默认的五个区域)。 图2显示了这种分割操作的一个例子。 原始图像中的每个像素位置具有特定的统计加权系数,取决于其梯度幅度。系数确定为如下:
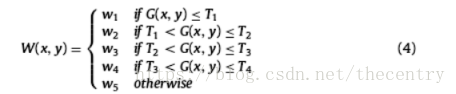
where denotes the limits of the gradient intervals, is the statistical weighting coefficients (usuallydue to the different contribution to image contrast enhancement, the next half of Section 2 will discuss how to determine the optimal weighting coefficients).
其中,表示梯度区间的界限,是统计加权系数(通常是对图像对比度增强的不同贡献,第二部分的下半部分将讨论如何确定最佳加权系数)。
(4) Compute the cumulative summation of the weighted statistical values of each gray level in different regions:
(4)计算不同地区各灰度级加权统计值的累加和:

where is the number of pixels at the gray level r in a certain region. N(r) is the summation of all weighted statistical values of the gray level r in the five regions. It should be pointed out that the standard histogram is a special case of our new histogram,that is, when 
其中是某个区域中灰度级r处的像素数量。N(r)是五个区域中灰度级r的所有加权统计值的总和。 应该指出的是,标准直方图是我们新的直方图的特例,也就是说,两种直方图的分量具有相同的值时
2.2. Determination of the optimal parameters
In the previous paragraph, we describe the basic procedure of this new histogram. In order to obtain desired histogram shape for image contrast enhancement, several problems should be solved.
Here, we list these problems as follows:
l Choose a proper number of equal-sized regions.
l .Choose a robust method to evaluate the distribution of detailed information.
l Choose the optimal weighting coefficients.
2.2。 确定最佳参数
在前一段中,我们描述了这个新直方图的基本过程。 为了获得期望的图像对比度增强的直方图形状,应该解决几个问题。
在这里,我们列出这些问题如下:
l 选择适当数量的相同大小的区域。
l 选择一个稳健的方法来评估详细信息的分布。
l 选择最佳的加权系数。
As mentioned previously, we use a default value(i.e.5) as the number of regions. The choice of this number is also based on the fact that the percentage area of the detailed regions in the entire image is usually in the range of 20-80% (e.g., the detailed region covers nearly 20%area in the simple line drawing (Fig. 5(a)), but,over 70% in the complex image of a town, as shown in Fig. 5(d)). We choose the lowest limit ( i.e., 20%) as the size of the region, and therefore the corresponding total number of regions is five. Moreover,from multiple trials, we found that the resulting histogram shape is not very sensitive to the number of the regions if the number is over 4, and a large number of regions would cost more computationally.
如前所述,我们使用默认值(即5)作为区域的数量。 这个数字的选择也是基于以下事实:整个图像中的详细区域的百分比面积通常在20-80%的范围内(例如,详细区域覆盖简单线条图中的近20%区域 图5(a)),但在城镇的复杂图像中超过70%,如图5(d)所示)。 我们选择最低限度(即20%)作为区域的大小,因此相应的区域总数为5。 此外,从多次试验中,我们发现,如果数量超过4,所得的直方图形状对区域数量不是很敏感,并且大量区域的计算成本会更高。
The next problem is to develop a robust method to evaluate the distribution of details in a given image. This is important because it can provide useful information for estimating the regions' contribution for the image enhancement. Here, we propose a simple solution. We use the Canny edge detection technique to evaluatethe distribution of details. The Canny edge detection algorithm is a robust and accurate edge detection methods. The motivation for this solution is that if a region contains many details, it generally has large number of edge points. In other words, the amount of details is equivalent to the number of edge points. Therefore, the distribution of details in different regions is executed as follows: (1) detect the edge in the input image using the Canny edge detection operator; (2) count the number of edge points in different regions. Test examples are given in Fig. 5. The results of edge detection are shown in Fig. 5(e)-(h). The number of edge points in different regions is listed in Table 1.
下一个问题是发展一种稳健的方法来评估细节在给定图像中的分布。这一点很重要,因为它可以为估计区域对图像增强的贡献提供有用的信息。在这里,我们提出了一个简单的解决方案。我们使用Canny边缘检测技术来评估细节的分布Canny边缘检测算法是一种稳健、准确的边缘检测方法。这个解决方案的依据是,如果一个区域包含许多细节,它通常有大量的边缘点。换句话说,换句话说,细节的数量相当于边缘点的数量。因此,在不同区域中的细节分布被执行如下:(1)利用Canny边缘检测算子来检测输入图像中的边缘;(2)计算不同区域的边缘点数。试验实例如图5所示。边缘检测结果如图5(E)-(H)所示。表1列出了不同区域的边缘点数。
The final problem is how to choose appropriate weighing coefficients in order to perform the weighting process to yield a desired histogram shape for image contrast enhancement. One can specify these coefficients in an empirical way to yield satisfactory results,but this precludes the new histogram from being applied in many cases in which full automatic processing are needed. Furthermore,since there are five parameters, direct trial-and-error requires a lot of work. Here, we developed a simple method to overcome this problem. Our idea is to normalize the number of edge points in different regions to generate their corresponding weighting coeffidents. The equation can be represented as follows:
最后一个问题是如何选择合适的加权系数,以进行加权处理,从而得到所需的直方图形状以增强图像对比度。我们可以指定这些用经验方法得到满意结果的系数,但这就排除了新的直方图在许多需要全自动处理的情况下应用的可能性。此外,由于这里有五个参数,直接试验和错误测试需要做大量的工作.在这里,我们开发了一个简单的方法来克服这个问题。我们的想法是规范不同区域的边缘点的数目以产生相应的加权系数。方程可表示如下:
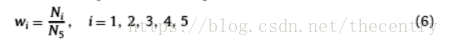
where Ni is the number of edge points in region i,N5 denotes thenumber of edge points in regions 5 which contains the biggest number of edge points.
其中Ni是区域I中的边点数,N5表示包含最大边点数的区域5中的边点数。
Using Eq. (6), normalized weighting coefficients for Fig. 5(a)-(d ),are calculated and listed in Table 2. Here, we highlight some examples to show the effectiveness of this normalized operation. For the simple images, e.g., line drawing in Fig. 5(a), regions with the highest gradients covers all the details, as shown in Fig. 5(i), so that the weighting coefficients of other regions are zero which indicates these regions have no details. For more complex images,the regions does not capture all details (see zoomed images of Figs. 6 and 7), e.g., in Fig. 7, the minor textures on the cap are not included in the regions. Some details are located in region 4 and region 3, and the corresponding coefficients show their contribution to the representation of image details. It is worth noting that these results agree well with those of visual perception.
使用Eq(6)计算了图5(a)-(d)的归一化加权系数,并列在表2中。这里,我们重点介绍一些示例,以说明这种规范化操作的有效性。对于简单的图像,例如图5(a)中的线条图,具有最高梯度的区域覆盖了所有细节,如图5(i)所示,使得其他区域的加权系数为零,表示这些 地区没有细节。 对于更复杂的图像,区域不捕获所有细节(参见图6和7的缩放图像),例如在图7中,帽子上的次要纹理不包括在区域中。 一些细节位于区域4和区域3中,并且相应的系数显示它们对图像细节表示的贡献。值得注意的是,这些结果与视觉感知的结果非常吻合。
3. Experimental results and comparisons
3.实验结果与比较
Fig. 8. Comparison of the results for the line drawing using different enhancement techniques. (a) Low-contrast original image, and (b) its standard histogram, (c) Gray-level information histogram. Note that the amplitude of the rightmost component has been reduced. (d) Result of GHE, (e) result of CLAHE, and (f) result of optimized GHE; (g) histogram for (d), (h) Histogram for (e), and (i) histogram for (f)
图8.使用不同增强技术绘制线条的结果比较。(a)低对比度原始图像,(b)是其标准直方图,(c)灰度信息直方图。 请注意最右边的分量的振幅已经降低。(d)GHE的结果,(e)CLAHE的结果,以及(f)优化的GHE的结果; (g)是(d)的直方图,(h)是(e)的直方图和(i)是(f)的直方图,
Fig. 9. Comparison of the results for X-ray image of two hands using different enhancement techniques. (a) Original image, (h) result of GHE, (c) result of CLAHE, (d) result of optimized GHE, and (e) result of optimized CLAHE
图9.用不同的增强技术对两只手的X射线图像的结果进行比较。(A)原始图像,(H)HE的结果,(C)CLAHE的结果,(D)优化的HE和(E)的结果。Clahe优化结果
l To verify the effectiveness of our new form of histogram,we apply this new histogram to two conventional histogram-based image enhancement techniques: GHE method (a well-known global technique) and CLAHE method (a popular local adaptive technique). Incorporation of gray-level information histogram into the existing contrast enhancement techniques is straightforward. One only needs to insert the new histogram into these algorithms.In order to distinguish the enhancement methods using gray-level information histogram from the conventional methods using standard histogram, we define the method using the new histogram as"optimized method", e.g., optimized GHE method. Fig. 8 shows the optimized GHE result of the line drawing with comparison to the GHE result and CLAHE result. Fig. 8(a) illustrates a line drawing, and Fig. 8(b) its standard histogram which contams six nonzero components. Due to the highest amplitude of the rightmost component, the resulting histogram of GHE is shifted toward the left side of the grayscale and most of the grayscale is empty, which causes significant contrast loss of detailed regions,as shown in Fig. 8(d). Note that the contrast of GHE result is even worse than that the original image. Fig. 8(e) is the CLAHE result. It can be seen that although CLAHE method can produce strong contrast enhancement, the character or content of the image (e.g., pixel value order or the number of nonzero components) is changed due to the local mapping nature of this technique, which is undesirable for many applications. Fig. 5(i) shows that regions covers all the details in the line drawing, and the corresponding weighting coefficients are w1=w2=w3=w4=0,w5=1, which means that the components of the resulting histogram in Fig. 8(c) is only the frequency of gray levels in regions. Note that the amplitude of the rightmost component has been reduced. Fig. 8(f) shows the enhanced image using optimized GHE method, and Fig. 8(i) its histogram in which the six components are uniformly spread over the entire grayscale. It is obvious that the contrast of the optimized GHE result is better than those of the CLAHE result and the original image
.
为了验证新的直方图形式的有效性,我们将新的直方图应用于两种传统的基于直方图的图像增强技术:GHE(一种著名的全局技术)和CLAHE方法(一种流行的局部自适应技术)。将灰度信息直方图纳入现有的对比度增强技术是很简单的.只需将新的直方图插入到这些算法中即可。为了区分采用灰度信息直方图的增强方法与传统的标准直方图增强方法,为了区分采用灰度信息直方图的增强方法与常规的标准直方图增强方法,本文将新直方图的增强方法定义为“优化法”。例如,优化的GHE方法。我们定义了以下方法:将新的直方图作为“优化方法”,如优化和方法。图8给出了绘制线图的优化结果,并与HE结果和CLAHE结果进行了比较。图8(A)是一条直线图,图8(B)是它的标准直方图,它包含六个非零分量。由于最右边分量的振幅最高,因此产生的GHE直方图向灰度左侧偏移,大部分灰度为空,导致详细区域的对比度明显下降,如图8(d)所示。请注意,GHE结果的对比度甚至比原始图像还要差。图8(E)是CLAHE结果。可以看出,虽然CLAHE方法可以产生很强的对比度增强,但图像的特征或内容(例如,像素值次序或非零分量的数量),由于这种技术的局部映射性质而改变,这在许多应用中是不可取的。图5(i)显示了区域覆盖了线图中的所有细节,并且相应的加权系数是w1 = w2 = w3 = w4 = 0,w5 = 1,这意味着图5中的结果直方图的分量 8(c)只是地区灰度级别的频率。请注意,最右边的组件的振幅已经降低。 图8(f)显示了使用优化的GHE方法的增强图像,以及图8(i)其直方图,其中六个分量均匀分布在整个灰度上。结果表明,优化后的和图像的对比度明显优于CLAHE结果和原始图像的对比度。
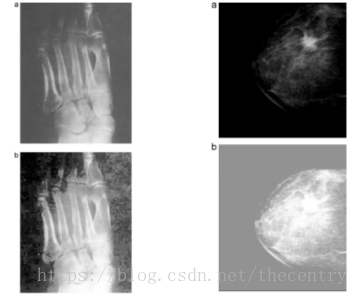
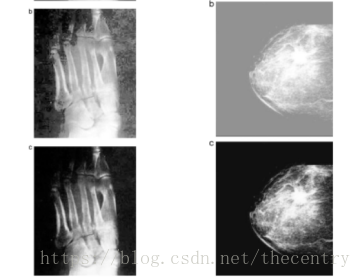
Fig.9 shows the comparison of the results of treating the X-ray image of two hands with different enhancement techniques including GHE, Optimized GHE, CLAHE and Optimized CLAHE. Fig. 9(a) shows a low-contrast X-ray image of two hands. Its GHE result,Fig.9(b), also looks faded and background noise has been amplifled. As mentioned in Section 2, the cause for this unsatisfactory appearance is that the background occupies nearly 60 percent of area in the original image and gray levels in this area are concentrated into a narrower range of grayscale (i.e., from 75 to 100 grayscale interval, as shown in Fig. 2(c)), which causes significant contrast loss of small detailed regions. Moreover, it can be seen that noise in the background is almost invisible before enhancement. However, it becomes apparent after enhancement. Fig. 9(d)shows the enhanced X-ray image after applying our new histogram into the GHE technique. It can be seen that the result of the optimized GHE technique is superior to that of the conventional GHE algorithm. The enhanced image, Fig. 9(d), not only exposes more image details, but also has little noise overenhancement.Fig. 9(c) shows CLAHE result, which is better than the GHE result (Fig. 9(b), but still has an undesirable appearance (i.e., noise overenhancement). Fig. 9(e) is the optimized CLAHE result. It is obvious that the optimized CLAHE algorithm outperforms the CLAHE and GHE techniques. Note that there is not much difference between the optimized CLAHE result and GHE result, and both images are satisfactory.
图9显示了不同增强技术治疗双手X线图像的结果比较,包括HE、优化的HE、CLAHE和优化的CLAHE。图9(a)显示了双手的低对比度X射线图像。其结果,从图9(B)可以看出,图像褪色,背景噪声已放大。正如第2节所述,造成这种不令人满意的外观的原因是背景在原始图像中占据了接近60%的面积,并且该区域中的灰度级被集中到较窄的灰度范围(即,从75到100灰度间隔,如图2(c)所示),这会导致小的细节区域的明显的对比度损失。此外,可以看出,背景中的噪声在增强之前几乎看不见。但是,增强后会变得明显。图9(d)显示了将新的直方图应用到GHE技术后的增强X射线图像。可以看出,优化的GHE技术的结果优于传统的GHE算法。增强图像(图9(d))不仅可以显示更多的图像细节,而且噪声也不会过度增强。图9(c)显示了CLAHE结果,它比GHE结果好(图9(b)),但仍然具有不希望的外观(即,噪声过强),图9(e)是优化的CLAHE结果。 CLAHE优化算法优于CLAHE和GHE技术,注意CLAHE优化结果与GHE结果差异不大,且两幅图像均满意。
From empirical results, we found that using our new histogram,even the simple method (e.g., GHE) can be conveniently applied to a broad variety of low-contrast images (e.g., simple line drawing,images with strong noise, etc.) and yields satisfactory results. More examples are given in Figs. 10 and 11.
根据实验结果,我们发现使用我们的新直方图,即使是简单的方法(例如,GHE)也可以方便地应用于各种低对比度图像(例如,简单线条画,具有强噪声的图像等)和 产生满意的结果。更多的例子在图10和11中给出。
4. Conclusion
It has been found that the regions with more details make great contribution to the image enhancement. However, the components of the standard histogram only show the frequency of gray levels,while ignoring the distribution of the details. This makes it difficult for many histogram-based techniques to generate satisfactory results. Therefore, this paper introduces a new form of histogram called gray-level information histogram. Compared with the conventional histogram, the amplitudes of its components can provide accurate assessment of the contribution of different gray levels to the image details depicting. Testing on various kinds of X-ray images shows that after using our new histogram, the optimized histogram-based techniques usually outperform the original methods with the same processing parameters. In addition, it should be pointed out that this proposed histogram is a new representation of the image. Like the standard histogram, it can be applied to other image processing applications, e.g., content-based image retrieval,which is currently under study in our research.
4 结论
已经发现具有更多细节的区域对图像增强作出了巨大贡献。但是,标准直方图的分量仅显示灰度级的频率,而忽略细节的分布。这使许多基于直方图的技术难以产生令人满意的结果。因此,本文介绍了一种称为灰度信息直方图的新形式直方图。与传统直方图相比,其分量的幅度可以准确评估不同灰度级对图像细节描绘的贡献。对各种X射线图像进行测试表明,在使用我们的新直方图之后,基于直方图的优化技术通常优于相同处理参数的原始方法。另外,应该指出的是,这个提出的直方图是图像的新表示。像标准直方图一样,它可以应用于其他图像处理应用,例如基于内容的图像检索,目前我们的研究正在进行研究。
Acknowledgements
This work was supported in part by the National Natural Science Foundation of China under Grant Nos. 60802051, 60875053,in part by Tianjin Natural Science Foundation under Grant No.09JCYBJC02100, in part by Youth Foundation of Tianjin University,and in part by China '863' High-Tech Program under Grant No.2007AA04Z219. M. Zeng would like to thank the support of CityUniversity of Hong Kong (Project No. 7002511).
致谢
国家自然科学基金资助项目(60802051,60875053)部分资助,天津自然科学基金资助项目09JCYBJC02100部分资助,天津大学青年基金资助项目部分资助, 863'高科技计划项目编号:2007AA04Z219。 M. Zeng感谢香港城市大学的支持(项目编号:7002511)。
原文下载链接:https://download.csdn.net/download/thecentry/10528544