需求
实现方式
两种方法
方法一:color: new echarts.graphic.LinearGradient(0, 0, 0, 1, [{},{},{}])
方法二:避开new echarts,color: {x: 0, y: 0, x2: 0, y2: 1,colorStops: [{},{},{}]}
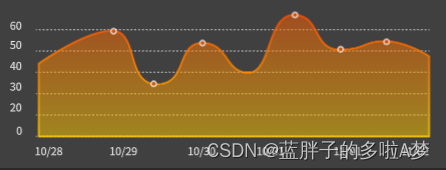
option = {


  xAxis: {


    type: 'time',
    data: ['10/28', '10/29', '10/30', '10/31', '11/01', '11/02']
  },
  yAxis: {


    type: 'value'
  },
  series: [
    {


      data: [120, 200, 150, 80, 70, 110, 130],
      type: 'line',
      areaStyle: {

      // 使用方法二的写法
         color: {


           type: 'linear',
           x: 0,  //右
           y: 0,  //下
           x2: 0,  //左
           y2: 1,  //上
           colorStops: [
             {


                offset: 0,
                color: '#A05920' // 0% 处的颜色
            },
            {


               offset: 1,
               color: '#C7982A' // 100% 处的颜色
            }
          ]
         }
     },
      emphasis: {

     // 选中时的颜色
        itemStyle: {

     // 使用方法一的写法
          color: new echarts.graphic.LinearGradient(0, 0, 0, 1, [
            {

     offset: 0, color: '#A05920' },
            {

     offset: 1, color: '#C7982A' }
          ])
        }
      }
    }
  ]
};
tips:
如果new echarts.graphic.LinearGradient报错,不能正常显示
可使用:new this.$echarts.graphic
  color: [
                    new this.$echarts.graphic.LinearGradient(0, 0, 0, 1, [
                        {

     offset: 0, color: '#A05920' },
                        {

     offset: 1, color: '#C7982A' }
                    ]),
                    new this.$echarts.graphic.LinearGradient(0, 0, 0, 1, [
                        {

     offset: 1, color: "#08DDF280" },
                        {

     offset: 0, color: "#3D9CF580" },
                    ]),

       ], //自定义颜色