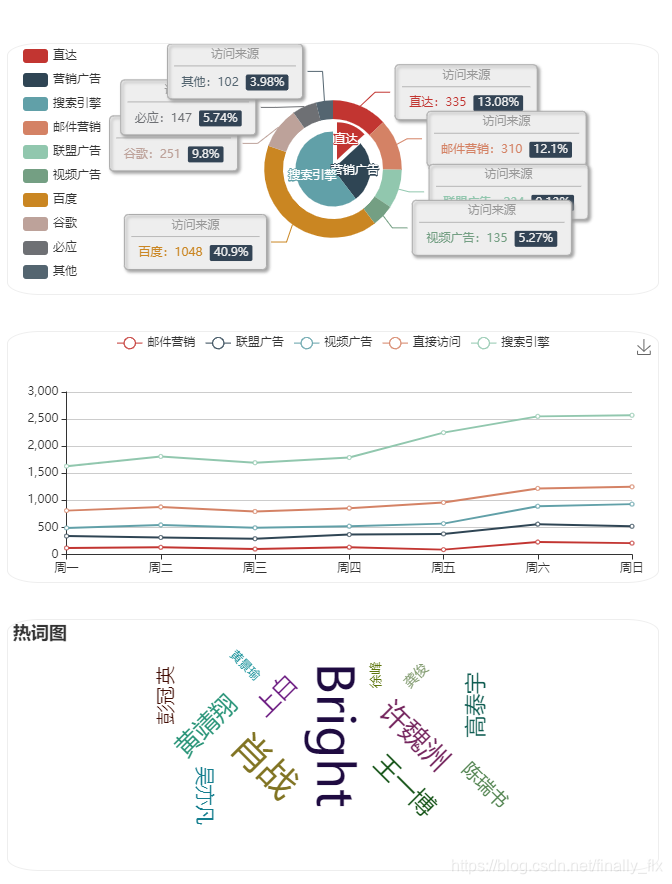
实现效果图
使用步骤
(1) 安装依赖
npm install echarts
npm install echarts-wordcloud
(2) main.js中引用
import echarts from 'echarts'
Vue.prototype.$echarts = echarts

import 'echarts-wordcloud'
(3) 在本地建立静态数据文件
optionFirst, optionSecond来自ECharts官网
let optionFirst = {
    tooltip: {
        trigger: 'item',
        formatter: '{a} <br/>{b}: {c} ({d}%)'
    },
    legend: {
        orient: 'vertical',
        left: 10,
        data: ['直达', '营销广告', '搜索引擎', '邮件营销', '联盟广告', '视频广告', '百度', '谷歌', '必应', '其他']
    },
    series: [
        {
            name: '访问来源',
            type: 'pie',
            selectedMode: 'single',
            radius: [0, '30%'],

            label: {
                position: 'inner'
            },
            labelLine: {
                show: false
            },
            data: [
                { value: 335, name: '直达', selected: true },
                { value: 679, name: '营销广告' },
                { value: 1548, name: '搜索引擎' }
            ]
        },
        {
            name: '访问来源',
            type: 'pie',
            radius: ['40%', '55%'],
            label: {
                formatter: '{a|{a}}{abg|}\n{hr|}\n  {b|{b}:}{c}  {per|{d}%}  ',
                backgroundColor: '#eee',
                borderColor: '#aaa',
                borderWidth: 1,
                borderRadius: 4,
                shadowBlur: 3,
                shadowOffsetX: 2,
                shadowOffsetY: 2,
                shadowColor: '#999',
                padding: [0, 7],
                rich: {
                    a: {
                        color: '#999',
                        lineHeight: 22,
                        align: 'center'
                    },
                    hr: {
                        borderColor: '#aaa',
                        width: '100%',
                        borderWidth: 0.5,
                        height: 0
                    },
                    b: {
                        fontSize: 12,
                        lineHeight: 33
                    },
                    per: {
                        color: '#eee',
                        backgroundColor: '#334455',
                        padding: [2, 4],
                        borderRadius: 2
                    }
                }
            },
            data: [
                { value: 335, name: '直达' },
                { value: 310, name: '邮件营销' },
                { value: 234, name: '联盟广告' },
                { value: 135, name: '视频广告' },
                { value: 1048, name: '百度' },
                { value: 251, name: '谷歌' },
                { value: 147, name: '必应' },
                { value: 102, name: '其他' }
            ]
        }
    ]
};
let optionSecond = {
    tooltip: {
        trigger: 'axis'
    },
    legend: {
        data: ['邮件营销', '联盟广告', '视频广告', '直接访问', '搜索引擎']
    },
    grid: {
        left: '3%',
        right: '4%',
        bottom: '3%',
        containLabel: true
    },
    toolbox: {
        feature: {
            saveAsImage: {}
        }
    },
    xAxis: {
        type: 'category',
        boundaryGap: false,
        data: ['周一', '周二', '周三', '周四', '周五', '周六', '周日']
    },
    yAxis: {
        type: 'value'
    },
    series: [
        {
            name: '邮件营销',
            type: 'line',
            stack: '总量',
            data: [120, 132, 101, 134, 90, 230, 210]
        },
        {
            name: '联盟广告',
            type: 'line',
            stack: '总量',
            data: [220, 182, 191, 234, 290, 330, 310]
        },
        {
            name: '视频广告',
            type: 'line',
            stack: '总量',
            data: [150, 232, 201, 154, 190, 330, 410]
        },
        {
            name: '直接访问',
            type: 'line',
            stack: '总量',
            data: [320, 332, 301, 334, 390, 330, 320]
        },
        {
            name: '搜索引擎',
            type: 'line',
            stack: '总量',
            data: [820, 932, 901, 934, 1290, 1330, 1320]
        }
    ]
};
let optionThird = {
    title: {
        text: '热词图'
    },
    series: [{
        type: 'wordCloud',
        gridSize: 20,
        sizeRange: [12, 50],
        rotationRange: [-90, 90],
        shape: 'pentagon',
        textStyle: {
            normal: {
                color: function () {
                    return 'rgb(' + [
                        Math.round(Math.random() * 160),
                        Math.round(Math.random() * 160),
                        Math.round(Math.random() * 160)
                    ].join(',') + ')';
                }
            },
            emphasis: {
                shadowBlur: 10,
                shadowColor: '#333'
            }
        },
        data: [{name: '肖战', value: 10000,},
                {name: '王一博', value: 6181},
                {name: '吴亦凡', value: 4386},
                {name: '陈瑞书', value: 4055},
                {name: '龚俊', value: 2467},
                {name: '徐峰', value: 2244},
                {name: '黄景瑜', value: 1898},
                {name: 'Bright', value: 14484},
                {name: '许魏洲', value: 7112},
                {name: '黄靖翔', value: 6112},
                {name: '高泰宇', value: 5112},
                {name: '彭冠英', value: 4312},
                {name: '上白', value: 5612},
            ]
    }]
};
export {
    optionFirst,
    optionSecond,
    optionThird
}
(4) vue文件中使用
<template>
  <div>
    <div id="myChartFirst" class="containEcharts"></div><br/><br/>
    <div id="myChartSecond" class="containEcharts"></div><br/><br/>
    <div id="myChartThird" class="containEcharts"></div><br/><br/>
  </div>
</template>

<script>
// 导入静态数据文件
import {
  optionFirst,
  optionSecond,
  optionThird
} from "../../../../static/staticData/options";

export default {
  name: "simpleEcharts",
  data() {
    return {};
  },
  mounted() {
    this.drawLine();
  },
  methods: {
    drawLine() {
      // 初始化echarts实例
      let myChartFirst = this.$echarts.init(
        document.getElementById("myChartFirst")
      );
      let myChartSecond = this.$echarts.init(
        document.getElementById("myChartSecond")
      );
      let myChartThird = this.$echarts.init(
        document.getElementById("myChartThird")
      );

      // 绘制图表
      myChartFirst.setOption(optionFirst);
      myChartSecond.setOption(optionSecond);
      myChartThird.setOption(optionThird);
    },
  }
};
</script>
<style scoped>
.containEcharts {
  width: 650px;
  height: 250px;
  border: 1px solid #eee;
  border-radius: 5%;
}
</style>
