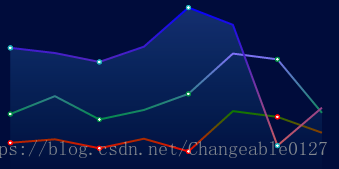
主要美化包括:
1、背景透明
2、隐藏坐标轴
3、曲线颜色渐变
4、曲线区域颜色渐变
var option = {
                backgroundColor:'',//背景颜色透明
                tooltip: {
                    trigger: 'axis',//鼠标经过提示
                },
                legend: {
                    icon : 'roundRect',//icon为圆角矩形
                    x: 'center',
                    y: 'bottom',
                    data:['样例1','样例2','样例3'],
                    textStyle:{//图例文字的样式
                        color:'#fff',
                        fontSize:16
                    }
                },
                grid: {
                    left: 0,
                    top :'5%',
                    left: 0,
                    bottom: '5%',
                    containLabel:true
                },
                xAxis: {
                    type: 'category',
                    data: arrDate,
                    show: false//隐藏x轴
                },
                yAxis: {
                    type: 'value',
                    splitLine:{show: false},//去除网格线
                    show: false//隐藏y轴
                },
                color: ['#1DB0B8', '#37C6C0', '#D0E9FF', '#c7353a', '#f5b91e'],
                series: [
                    {
                        name:'样例1',
                        type:'line',
                        itemStyle: {
                            normal: {
                                color: 'red',
                                lineStyle: {        // 系列级个性化折线样式
                                    width: 2,
                                    type: 'solid',
                                    color: new echarts.graphic.LinearGradient(0, 0, 0, 1, [{
                                        offset: 0,
                                        color: 'green'
                                    }, {
                                        offset: 1,
                                        color: 'red'
                                    }]),//线条渐变色
                                }
                            },
                            emphasis: {
                                color: 'red',
                                lineStyle: {        // 系列级个性化折线样式
                                    width: 2,
                                    type: 'dotted',
                                    color: new echarts.graphic.LinearGradient(0, 0, 0, 1, [{
                                        offset: 0,
                                        color: 'green'
                                    }, {
                                        offset: 1,
                                        color: 'red'
                                    }])
                                }
                            }
                        },//线条样式
                        data:[120, 132, 101, 134, 90, 230, 210,155]
                    },
                    {
                        name:'样例2',
                        type:'line',
                        itemStyle: {
                            normal: {
                                color: '#008B45',
                                lineStyle: {        // 系列级个性化折线样式
                                    width: 2,
                                    type: 'solid',
                                    color: new echarts.graphic.LinearGradient(0, 0, 0, 1, [{
                                        offset: 0,
                                        color: '#8470FF'
                                    }, {
                                        offset: 1,
                                        color: '#008B45'
                                    }]),//线条渐变色
                                }
                            },
                            emphasis: {
                                color: '#008B45',
                                lineStyle: {        // 系列级个性化折线样式
                                    width: 2,
                                    type: 'dotted',
                                    color: new echarts.graphic.LinearGradient(0, 0, 0, 1, [{
                                        offset: 0,
                                        color: '#00FFFF'
                                    }, {
                                        offset: 1,
                                        color: '#5F9EA0'
                                    }])
                                }
                            }
                        },//线条样式
                        data:[220, 282, 201, 234, 290, 430, 410,224]
                    },
                    {
                        name:'样例3',
                        type:'line',
                        itemStyle: {
                            color: '#6A5ACD',
                            normal: {
                                lineStyle: {        // 系列级个性化折线样式
                                    width: 2,
                                    type: 'solid',
                                    color: new echarts.graphic.LinearGradient(0, 0, 0, 1, [{
                                        offset: 0,
                                        color: '#0000FF'
                                    }, {
                                        offset: 1,
                                        color: '#CD5C5C'
                                    }]),//线条渐变色
                                }
                            },
                            emphasis: {
                                color: '#6A5ACD',
                                lineStyle: {        // 系列级个性化折线样式
                                    width: 2,
                                    type: 'dotted',
                                    color: new echarts.graphic.LinearGradient(0, 0, 0, 1, [{
                                        offset: 0,
                                        color: '#1E90FF'
                                    }, {
                                        offset: 1,
                                        color: '#0000FF'
                                    }])
                                }
                            }
                        },//线条样式
                        areaStyle:{
                            normal:{
                               //颜色渐变函数 前四个参数分别表示四个位置依次为左、下、右、上
                                color: new echarts.graphic.LinearGradient(0, 0, 0, 1, [{

                                    offset: 0,
                                    color: 'rgba(80,141,255,0.39)'
                                }, {
                                    offset: .34,
                                    color: 'rgba(56,155,255,0.25)'
                                },{
                                    offset: 1,
                                    color: 'rgba(38,197,254,0.00)'
                                }])

                            }
                        },//区域颜色渐变
                        data:[450, 432, 401, 454, 590, 530, 110,242]
                    }
                ]
            };
效果图