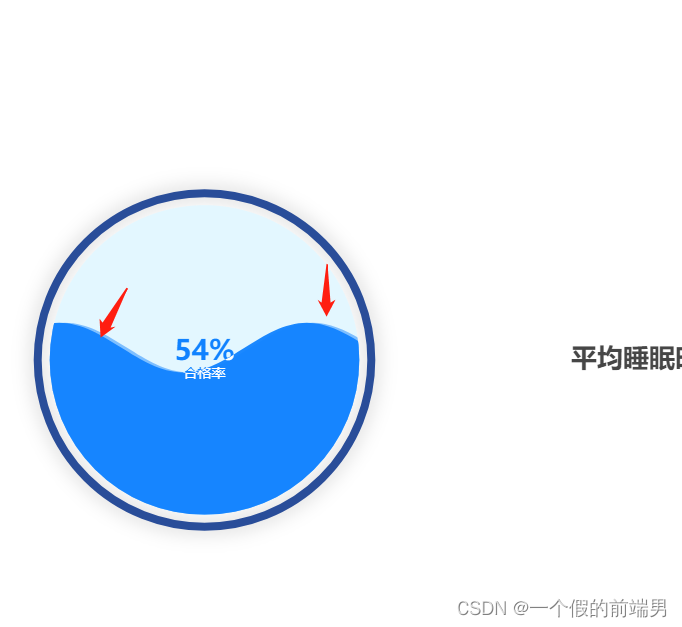
如图所示 箭头所指的灰色阴影
本案例 不包含水滴图的引入 请自行百度
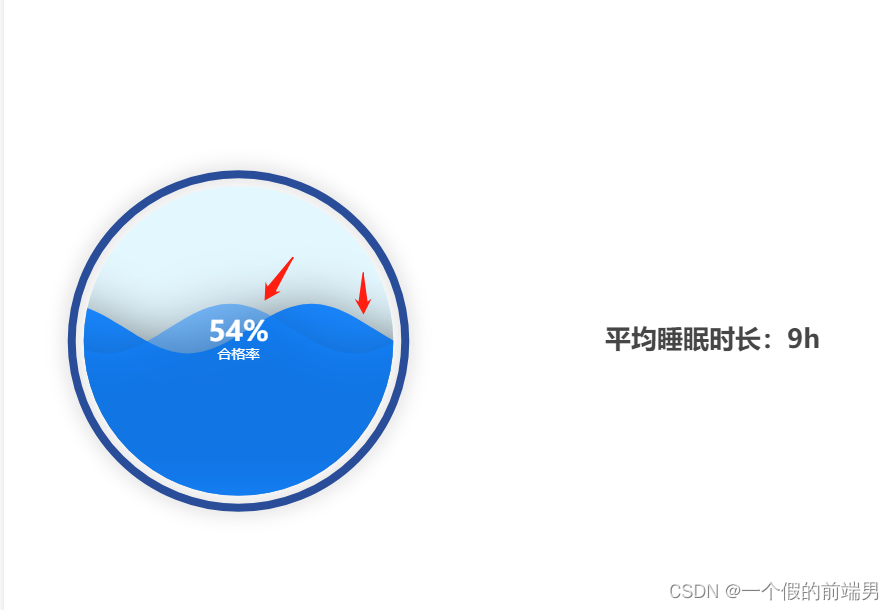
let text = '平均睡眠时长:9h';
option = {
	title: [{
		text: text,
		textStyle: {
			fontSize: 26
		},
		textAlign: 'center',
		left: '75%',
		bottom: 'middle',
	}, ],
	series: [{
		name: '合格率',
		type: 'liquidFill',
		color: ['#1082FF', 'rgba(16, 130, 255, 0.5)'],
		data: [
			0.54,
			{
				value: 0.54,
				direction: 'left',
			},
		],
		center: ['25%', '50%'],
		radius: '40%',
		label: {
			formatter: function(p) {
				return `{b|${p.value * 100}}%\n{a|${p.seriesName}}`;
			},
			rich: {
				a: {
					fontSize: 14,
				},
			},
			position: ['50%', '50%'],
			fontSize: 28,
			fontWeight: 700,
			fontFamily: 'SourceHanSansCN',
			color: '#1082FF',
		},
	}, ],
};
去掉阴影的方式为:添加如下代码
		itemStyle: {
			opacity: 0.95,
			shadowColor: 'rgba(0, 0, 0, 0)',
		},
完整代码
let text = '平均睡眠时长:9h';
option = {
	title: [{
		text: text,
		textStyle: {
			fontSize: 26
		},
		textAlign: 'center',
		left: '75%',
		bottom: 'middle',
	}, ],
	series: [{
		name: '合格率',
		type: 'liquidFill',
		color: ['#1082FF', 'rgba(16, 130, 255, 0.5)'],
		data: [
			0.54,
			{
				value: 0.54,
				direction: 'left',
			},
		],
		center: ['25%', '50%'],
		radius: '40%',
		itemStyle: {
			opacity: 0.95,
			shadowColor: 'rgba(0, 0, 0, 0)',
		},
		label: {
			formatter: function(p) {
				return `{b|${p.value * 100}}%\n{a|${p.seriesName}}`;
			},
			rich: {
				a: {
					fontSize: 14,
				},
			},
			position: ['50%', '50%'],
			fontSize: 28,
			fontWeight: 700,
			fontFamily: 'SourceHanSansCN',
			color: '#1082FF',
		},
	}, ],
};