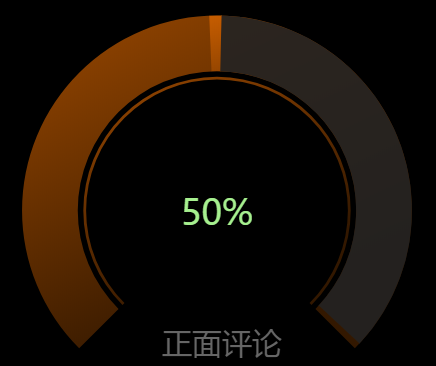
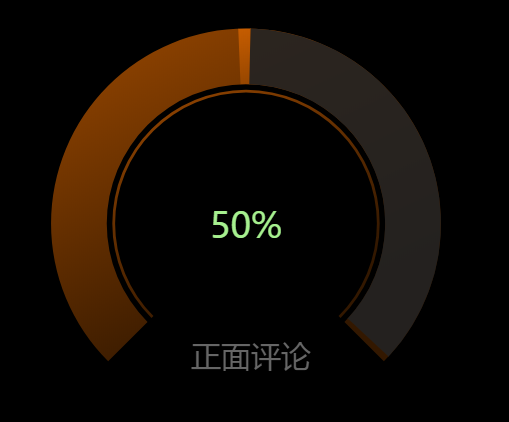
今天做了一个渐变,而且是3/4环形图,记录一下思路,当作笔记,有遇到和我一样问题的小伙伴可以参考一下
参考文档:http://echarts.baidu.com/option.html#series-pie.startAngle
先说几个用到的属性
官方说明:
series[i]-pie.startAngle number
[ default: 90 ]
起始角度,支持范围[0, 360]。
这个属性可以改变环形图的角度
  1 var percent = 50;
  2 option = {
  3    backgroundColor: '#000',
  4     title: {
  5         "x": '50%',
  6         "y": '45%',
  7         textAlign: "center",
  8         top: '70%',
  9         'text':'正面评论',
 10         "textStyle": {
 11
 12             "fontWeight": 'normal',
 13             "color": '#666666',
 14             "fontSize": 30
 15         },
 16         "subtextStyle": {
 17             "fontWeight": 'bold',
 18             "fontSize": 18,
 19             "color": '#3ea1ff'
 20         },
 21
 22     },
 23     series: [{
 24         "name": ' ',
 25         "type": 'pie',
 26         "radius": ['50%', '70%'],
 27         "avoidLabelOverlap": false,
 28         "startAngle": 225,//起始角度,支持范围[0, 360]。
 29         "color": [{//设置环形渐变
 30             type: 'linear',
 31             x: 0,
 32             y: 0,
 33             x2: 0.4,
 34             y2: 1,
 35             colorStops: [{
 36                 offset: 0,
 37                 color: 'rgba(255,119,0,.6)'// 100% 处的颜色
 38             }, {
 39                 offset: 1,
 40                 color: 'rgba(255,119,0,0.1)' // 1% 处的颜色
 41             }],
 42             globalCoord: false // 缺省为 false
 43         }, 'none'],
 44         "hoverAnimation": false,//是否开启 hover 在拐点标志上的提示动画效果。
 45         "legendHoverLink": false,//是否启用图例 hover 时的联动高亮。
 46         "label": {
 47             "normal": {
 48                 "show": false,
 49                 "position": 'center'
 50             },
 51             "emphasis": {//高亮状态下视觉引导线的样式。
 52                 "show": true,
 53                 "textStyle": {
 54                     "fontSize": '30',
 55                     "fontWeight": 'bold'
 56                 }
 57             }
 58         },
 59         "labelLine": {//标签的视觉引导线样式,在 label 位置 设置为'outside'的时候会显示视觉引导线。
 60             "normal": {
 61                 "show": false//一般默认的时候写在normal里面
 62             }
 63         },
 64         "data": [{
 65             "value": 75,
 66             "name": '1'
 67         }, {
 68             "value": 25,
 69             "name": '2'
 70         }]
 71     },{
 72         "name": ' ',
 73         "type": 'pie',
 74         "radius": ['48%', '47%'],
 75         "avoidLabelOverlap": false,
 76         "startAngle": 225,
 77         "color": 'red',
 78         "hoverAnimation": false,
 79         "legendHoverLink": false,
 80         "label": {
 81             "normal": {
 82                 "show": false,
 83                 "position": 'center'
 84             },
 85             "emphasis": {
 86                 "show": true,
 87                 "textStyle": {
 88                     "fontSize": '30',
 89                     "fontWeight": 'bold'
 90                 }
 91             }
 92         },
 93         "labelLine": {
 94             "normal": {
 95                 "show": false
 96             }
 97         },
 98         "data": [{
 99             "value": 75,
100             "name": '1'
101         }, {
102             "value": 25,
103             "name": '2'
104         }]
105     }, {
106         "name": '',
107         "type": 'pie',
108         "radius": ['50%', '70%'],
109         "avoidLabelOverlap": false,
110         "startAngle": 317,
111         "color": ['rgba(34,34,34,.9)', "#ff7a00", "transparent"],
112         "hoverAnimation": false,
113         "legendHoverLink": false,
114         "clockwise": false,
115         "itemStyle": {
116             "normal": {
117                 "borderColor": "transparent",
118                 "borderWidth": "20"
119             },
120             "emphasis": {
121                 "borderColor": "transparent",
122                 "borderWidth": "20"
123             }
124         },
125         "z": 10,
126         "label": {
127             "normal": {
128                 "show": false,
129                 "position": 'center'
130             },
131             "emphasis": {
132                 "show": true,
133                 "textStyle": {
134                     "fontSize": '30',
135                     "fontWeight": 'bold'
136                 }
137             }
138         },
139         "labelLine": {
140             "normal": {
141                 "show": false
142             }
143         },
144         "data": [{
145             "value": (100 -percent) * 266 / 360,
146
147             "label": {
148                 normal: {
149                     formatter: percent+'%',
150                     position: 'center',
151                     show: true,
152                     textStyle: {
153                         fontSize: '35',
154                         fontWeight: 'normal',
155                         color: '#a6f08f'
156                     }
157                 }
158             },
159             "name": ''
160         }, {
161             "value": 1,
162             "name": ''
163         }, {
164             "value": 100 - (100 - percent) * 266 / 360,
165             "name": ''
166         }]
167     }, ]
168 };
这个图形的思路
比如你要50%的占比,percent=50
我们通过这个(100 -percent) * 266 / 360这个公式约等于37
100 - (100 - percent) * 266 / 360 =63
我不太明白这个公式为什么是乘以266*300 希望大牛指点。
 1 "data": [{
 2             "value": (100 -percent) * 266 / 360,
 3
 4             "label": {
 5                 normal: {
 6                     formatter: percent+'%',
 7                     position: 'center',
 8                     show: true,
 9                     textStyle: {
10                         fontSize: '35',
11                         fontWeight: 'normal',
12                         color: '#a6f08f'
13                     }
14                 }
15             },
16             "name": ''
17         }, {
18             "value": 1,
19             "name": ''
20         }, {
21             "value": 100 - (100 - percent) * 266 / 360,
22             "name": ''
23         }]
这个是个data里面要设置3个值,有一个为value=1是占位置的
扫描二维码关注公众号,回复:
75882 查看本文章

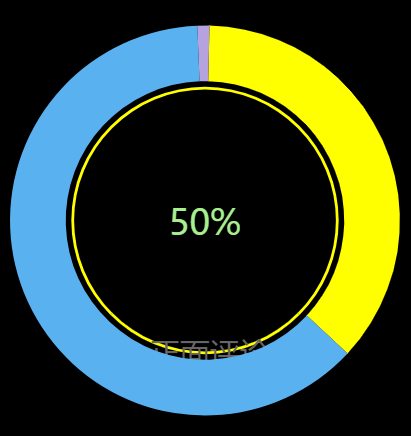
然后外面一层环形分为4部分,每部分各占25%,然后其中3部分合并一起,剩下一部分是25份,
这样就形成了最后的效果