毕业10年,回过头看线性代数,全部还给了老师。翻看《Machine Learning in Action》做做笔记
1 欧式距离计算
# -*- coding: utf-8 -*-
'''
Created on 2017年10月27日
@author: dzm
'''
from numpy import array, tile
import operator
def createDateSet():
'''
创建数据集和标签
:return:
:param group 数据矩阵
:param labels 向量包含了每个数据点的标签信息
'''
group = array([[1.0,1.1],[1.0,1.0],[0,0],[0,0.1]])
labels = ['A', 'A', 'B', 'B']
return group, labels
def classify0(inX, dataSet, labels, k):
'''
通过欧式距离公式,计算两个向量点xA和xB之间的距离。
@see: 瓯氏距离公式 http://blog.csdn.net/Losteng/article/details/50893931
@see: tile函数 http://blog.csdn.net/ksearch/article/details/21388985
@see: argsort函数 https://www.cnblogs.com/yyxf1413/p/6253995.html
@see: sorted函数 http://www.runoob.com/python/python-func-sorted.html
@see: operator.itemgetter http://mp.blog.csdn.net/mdeditor/79277992
:param inX: 用于分类的输入
:param dataSet: 输入的训练样本集
:param labels: 标签向量
:param k: 用于选择最近邻居的数目
:return:
'''
# dataSet为4*2的矩阵,通过shape获取行向量数量
dataSetSize = dataSet.shape[0]
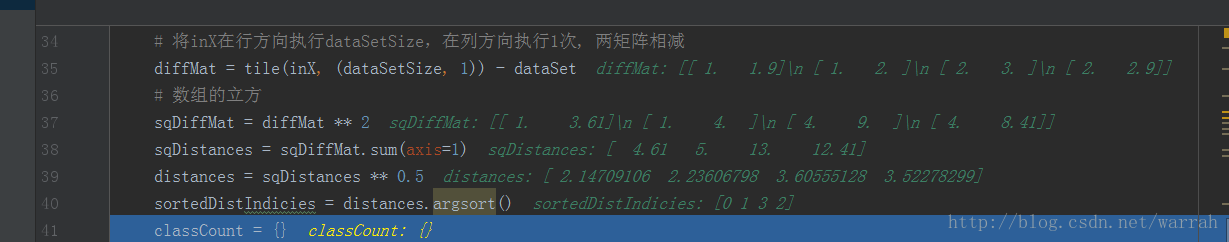
# 将inX在行方向执行dataSetSize,在列方向执行1次, 两矩阵相减
diffMat = tile(inX, (dataSetSize, 1)) - dataSet
# 数组的立方
sqDiffMat = diffMat ** 2
# 行数据相加,如果axis=0,则是列向量数据相加
sqDistances = sqDiffMat.sum(axis=1)
# 取根
distances = sqDistances ** 0.5
# 从小到排序,值为索引数组
sortedDistIndicies = distances.argsort()
classCount = {}
for i in range(k):
voteIlabel = labels[sortedDistIndicies[i]]
# classCount.get(voteIlabel, 0)是指不存在相对应key值的value则返回0
classCount[voteIlabel] = classCount.get(voteIlabel, 0) + 1
sortedClassCount = sorted(classCount.iteritems(), key=operator.itemgetter(1), reverse=True)
return sortedClassCount[0][0]
if __name__ == '__main__':
group,labels = createDateSet()
print classify0([2,3],group, labels, 3)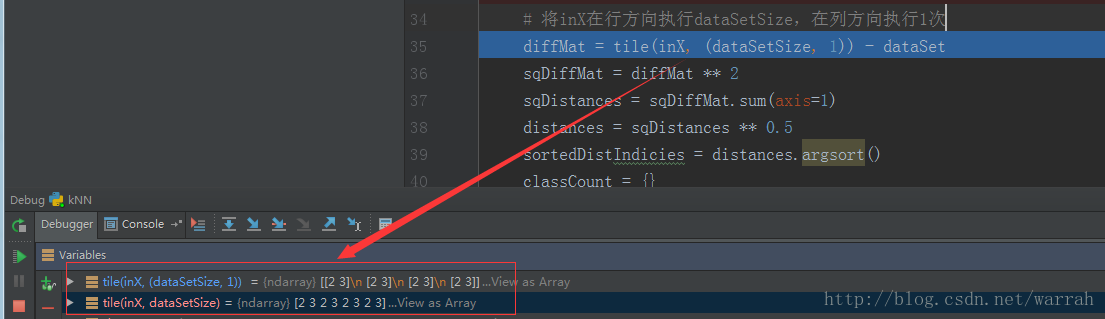
2 将文本记录转换为numpy可解析的格式
def file2matrix(filename):
    '''
    将待处理数据的格式改变为分类器可以接受的格式
    @see zeros函数 http://blog.csdn.net/qq_26948675/article/details/54318917
    :param filename: 数据文件路径
    :return:
    '''
    fr = open(filename)
    numberOfLines = len(fr.readlines())         #get the number of lines in the file
    returnMat = zeros((numberOfLines,3))        #prepare matrix to return
    classLabelVector = []                       #prepare labels return
    index = 0
    fr = open(filename)
    for line in fr.readlines():
        # 移除行数据中的空格
        line = line.strip()
        listFromLine = line.split('\t')
        returnMat[index,:] = listFromLine[0:3]
        classLabelVector.append(int(listFromLine[-1]))
        index += 1
    return returnMat,classLabelVector

if __name__ == '__main__':
    datingDataSet, datingLabels = file2matrix('F:\pythonwork\machinelearninginaction\Ch02\datingTestSet2.txt');
    print datingDataSet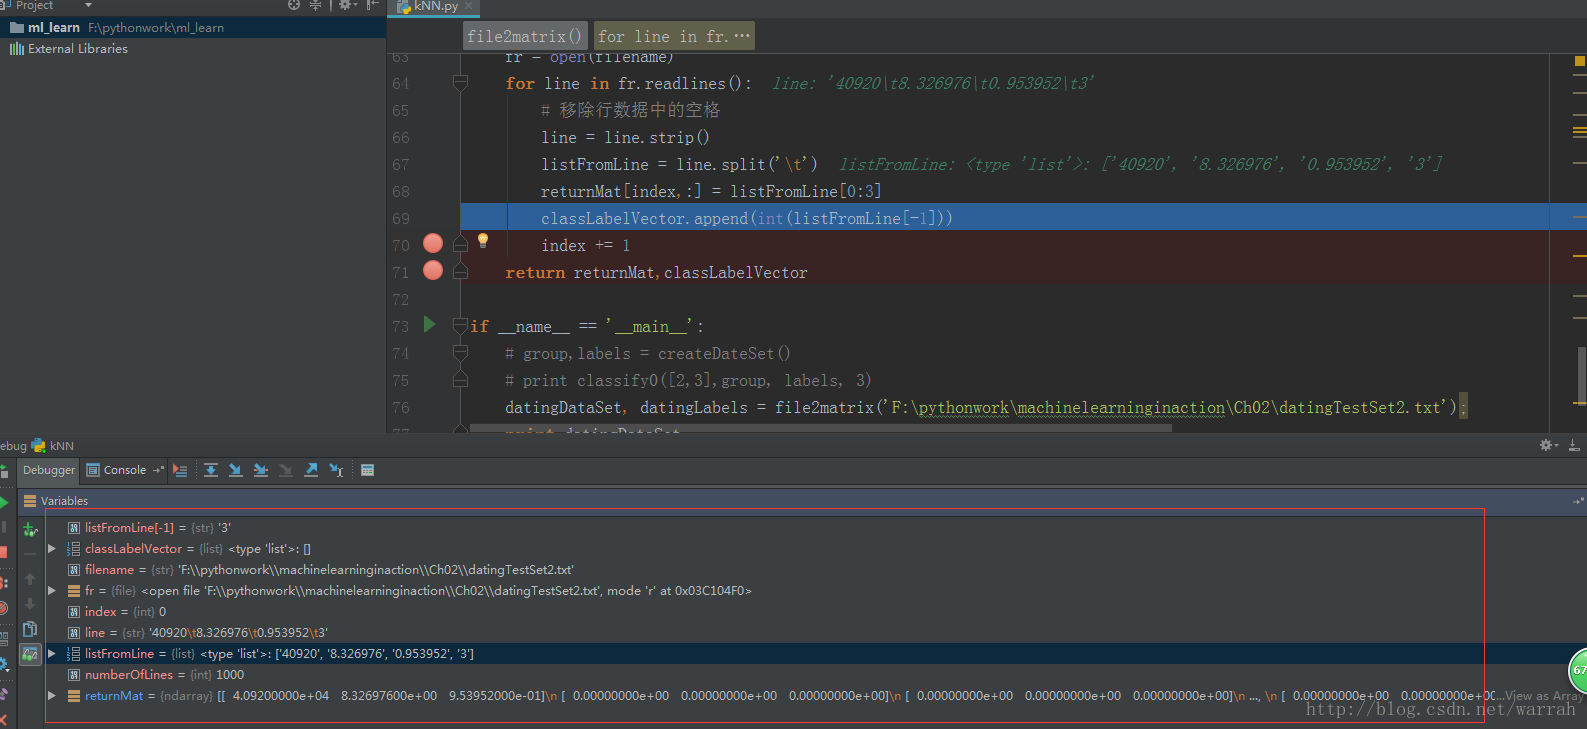
3 使用Matplotlib创建散点图
if __name__ == '__main__':
    datingDataSet, datingLabels = file2matrix('F:\pythonwork\machinelearninginaction\Ch02\datingTestSet2.txt');
    fig = plt.figure()
    ax = fig.add_subplot(111)
    ax.scatter(datingDataSet[:,1], datingDataSet[:,2])
    plt.show()
matplotlib.pyplot中add_subplot方法参数111的含义
4 数值归一化
本文中采用的是min-max标准化,也可参见三种常用数据标准化方法,按照最大尺度进行同比例缩放到0-1之间
def autoNorm(dataSet):
    '''
    归一化特征值
    @see http://blog.csdn.net/pipisorry/article/details/52247379
    :param dataSet:
    :return:
    '''
    # 以dataSet中以第0列取最小值
    minVals = dataSet.min(0)
    # 以dataSet中以第0列取最大值
    maxVals = dataSet.max(0)
    ranges = maxVals - minVals
    normDataSet = zeros(shape(dataSet))
    m = dataSet.shape[0]
    # 数据归一化:newValue = (oldValue-min)/(max-min)
    normDataSet = dataSet - tile(minVals, (m,1))
    normDataSet = normDataSet/tile(ranges, (m,1))   #element wise divide
    return normDataSet, ranges, minVals
5 计算分类错误率
def datingClassTest():
    '''
    计算分类错误率
    :return:
    '''
    # 10%的测试数据
    hoRatio = 0.1      #hold out 10%
    datingDataMat,datingLabels = file2matrix('F:\pythonwork\machinelearninginaction\Ch02\datingTestSet2.txt')       #load data setfrom file
    # 将数据归一化
    normMat, ranges, minVals = autoNorm(datingDataMat)
    m = normMat.shape[0]
    numTestVecs = int(m*hoRatio)
    errorCount = 0.0
    for i in range(numTestVecs):
        # 通过k近邻算法进行分类
        classifierResult = classify0(normMat[i,:],normMat[numTestVecs:m,:],datingLabels[numTestVecs:m],3)
        # 筛选出错误分类的数据
        if (classifierResult != datingLabels[i]):
            errorCount += 1.0
            print "the classifier came back with: %d, the real answer is: %d" % (classifierResult, datingLabels[i])
    print "the total error rate is: %f" % (errorCount/float(numTestVecs))
    print errorCount
6 通过输入的信息,找到她对对方喜欢程度的预测值
def classifyPerson():
    resultList = ['not at all', 'in small doses', 'in large doses']
    # raw_input是在控制台输入
    percentTats = float(raw_input("percentage of time spent playing video games?"))
    ffMiles = float(raw_input("frequent flier miles earned per year?"))
    iceCream = float(raw_input("liters of ice cream consumed per year?"))
    datingDataMat, datingLabels = file2matrix('F:\pythonwork\machinelearninginaction\Ch02\datingTestSet2.txt')
    normMat, ranges, minVals = autoNorm(datingDataMat)
    # inArr是新输入的数据,通过(inArr-minVals)/ranges对数据进行归一化处理
    inArr = array([ffMiles, percentTats, iceCream])
    classifierResult = classify0((inArr-minVals)/ranges, normMat, datingLabels, 3)
    print "you will probably like this person:",resultList[classifierResult-1]
缺点
1 k-近邻算法是基于实例的学习,使用算法时我们必须有接近实际数据的训练样本数数据,存储空间要求大
2 必须对数据集中的每个数据计算距离值,耗时
3 无法给出任何数据的基础结构信息,也无法知晓平均实例样本和典型实例样本具有什么特征。