1、k-means中使用欧氏距离,其实跟cosine distance一致。
证明:假设x和y已经归一化,也就是|x|和|y|都为1。

2、自己写的k-means程序
# Fill in the blanks
def kmeans(data, k, initial_centroids, maxiter, record_heterogeneity=None, verbose=False):
'''This function runs k-means on given data and initial set of centroids.
maxiter: maximum number of iterations to run.
record_heterogeneity: (optional) a list, to store the history of heterogeneity as function of iterations
if None, do not store the history.
verbose: if True, print how many data points changed their cluster labels in each iteration'''
centroids = initial_centroids[:]
prev_cluster_assignment = None
for itr in xrange(maxiter):
if verbose:
print(itr)
# 1. Make cluster assignments using nearest centroids
distances_from_centroids = pairwise_distances(data, centroids, metric='euclidean')
cluster_assignment = np.argmin(distances_from_centroids, axis=1)
# 2. Compute a new centroid for each of the k clusters, averaging all data points assigned to that cluster.
new_centroids = []
for i in xrange(k):
member_data_points = data[cluster_assignment==i]
centroid = member_data_points.mean(axis=0)
centroid = centroid.A1
new_centroids.append(centroid)
centroids = np.array(new_centroids)
# Check for convergence: if none of the assignments changed, stop
if prev_cluster_assignment is not None and \
(prev_cluster_assignment==cluster_assignment).all():
break
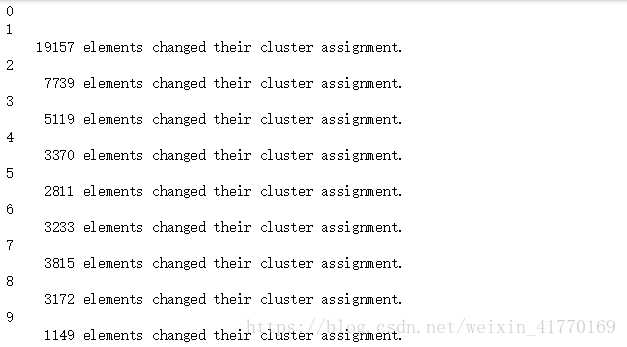
# Print number of new assignments
if prev_cluster_assignment is not None:
num_changed = np.sum(prev_cluster_assignment!=cluster_assignment)
if verbose:
print(' {0:5d} elements changed their cluster assignment.'.format(num_changed))
# Record heterogeneity convergence metric
if record_heterogeneity is not None:
score = compute_heterogeneity(data, k, centroids, cluster_assignment)
record_heterogeneity.append(score)
prev_cluster_assignment = cluster_assignment[:]
return centroids, cluster_assignment
def compute_heterogeneity(data, k, centroids, cluster_assignment):

    heterogeneity = 0.0
    for i in xrange(k):

        # Select all data points that belong to cluster i. Fill in the blank (RHS only)
        member_data_points = data[cluster_assignment==i, :]

        if member_data_points.shape[0] > 0: # check if i-th cluster is non-empty
            # Compute distances from centroid to data points (RHS only)
            distances = pairwise_distances(member_data_points, [centroids[i]], metric='euclidean')
            squared_distances = distances**2
            heterogeneity += np.sum(squared_distances)

    return heterogeneity
def plot_heterogeneity(heterogeneity, k):
    plt.figure(figsize=(7,4))
    plt.plot(heterogeneity, linewidth=4)
    plt.xlabel('# Iterations')
    plt.ylabel('Heterogeneity')
    plt.title('Heterogeneity of clustering over time, K={0:d}'.format(k))
    plt.rcParams.update({'font.size': 16})
    plt.tight_layout()
主函数调用:
k = 3
heterogeneity = []
initial_centroids = get_initial_centroids(tf_idf, k, seed=0)
centroids, cluster_assignment = kmeans(tf_idf, k, initial_centroids, maxiter=400,
                                       record_heterogeneity=heterogeneity, verbose=True)
plot_heterogeneity(heterogeneity, k)
运行结果:


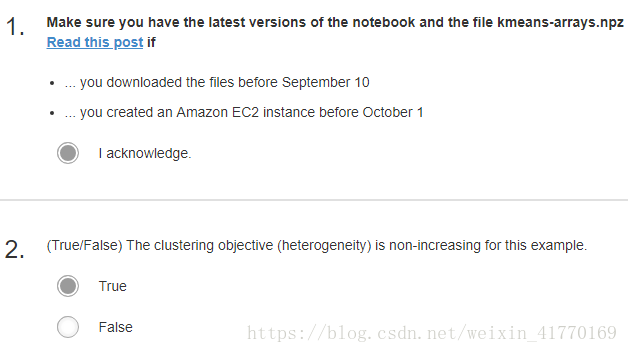
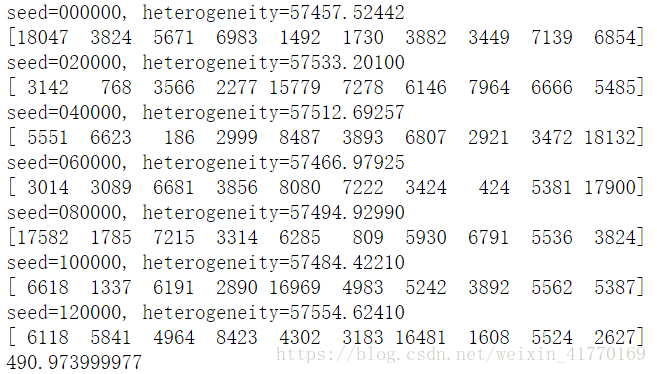
3、局部最小值问题
从下面的结果可以看出,不同的初始化结果,会得到不同的cluster分配结果。有时候,会得到局部最小值。
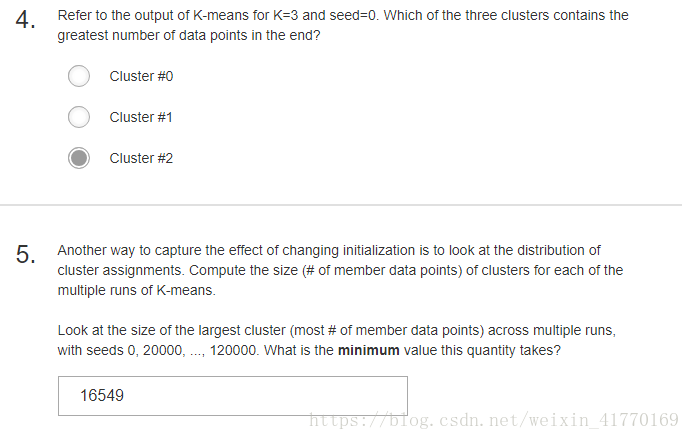
k = 10
heterogeneity = {}
import time
start = time.time()
for seed in [0, 20000, 40000, 60000, 80000, 100000, 120000]:
    initial_centroids = get_initial_centroids(tf_idf, k, seed)
    centroids, cluster_assignment = kmeans(tf_idf, k, initial_centroids, maxiter=400,
                                           record_heterogeneity=None, verbose=False)
    # To save time, compute heterogeneity only once in the end
    heterogeneity[seed] = compute_heterogeneity(tf_idf, k, centroids, cluster_assignment)
    print('seed={0:06d}, heterogeneity={1:.5f}'.format(seed, heterogeneity[seed]))
    print(np.bincount(cluster_assignment))
    sys.stdout.flush()
end = time.time()
print(end-start)
4、k++:更优的初始化。通过将初始center越远越好,来提高局部最优值的质量,并减少收敛时间。
def smart_initialize(data, k, seed=None):
    '''Use k-means++ to initialize a good set of centroids'''
    if seed is not None: # useful for obtaining consistent results
        np.random.seed(seed)
    centroids = np.zeros((k, data.shape[1]))

    # Randomly choose the first centroid.
    # Since we have no prior knowledge, choose uniformly at random
    idx = np.random.randint(data.shape[0])
    centroids[0] = data[idx,:].toarray()
    # Compute distances from the first centroid chosen to all the other data points
    squared_distances = pairwise_distances(data, centroids[0:1], metric='euclidean').flatten()**2

    for i in xrange(1, k):
        # Choose the next centroid randomly, so that the probability for each data point to be chosen
        # is directly proportional to its squared distance from the nearest centroid.
        # Roughtly speaking, a new centroid should be as far as from ohter centroids as possible.
        idx = np.random.choice(data.shape[0], 1, p=squared_distances/sum(squared_distances))
        centroids[i] = data[idx,:].toarray()
        # Now compute distances from the centroids to all data points
        squared_distances = np.min(pairwise_distances(data, centroids[0:i+1], metric='euclidean')**2,axis=1)

    return centroids
np.random.choice(data.shape[0], 1, p=squared_distances/sum(squared_distances))从数组range(data.shape[0])中,按照概率p=squared_distances/sum(squared_distances)得到1个索引,这索引对应的数作为新的center。
使用k++进行初始化,重新运行3中的例子:
k = 10
heterogeneity_smart = {}
start = time.time()
for seed in [0, 20000, 40000, 60000, 80000, 100000, 120000]:
    initial_centroids = smart_initialize(tf_idf, k, seed)
    centroids, cluster_assignment = kmeans(tf_idf, k, initial_centroids, maxiter=400,
                                           record_heterogeneity=None, verbose=False)
    # To save time, compute heterogeneity only once in the end
    heterogeneity_smart[seed] = compute_heterogeneity(tf_idf, k, centroids, cluster_assignment)
    print('seed={0:06d}, heterogeneity={1:.5f}'.format(seed, heterogeneity_smart[seed]))
    print(np.bincount(cluster_assignment))
    sys.stdout.flush()
end = time.time()
print(end-start)

可以看出,k++初始化center,得到的heterogeneity变化更小。
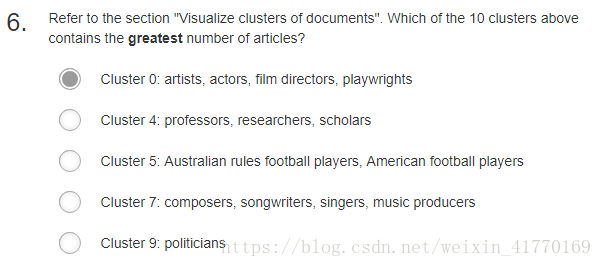
5、多次迭代k-means,选择heterogeneity最小时的cluster中心和聚类结果
6、测试
3、5错误:第3题 正确答案2