K均值聚类(K-Means)
k-means 算法:根据给定的数据样本构建 k 个划分聚类,每个划分聚类即为一个簇。
该算法是一个典型的基于距离的聚类算法,采用距离作为相似性的评价指标(两个样本的距离越近,相似度就越大)。

每个数据样本必须属于而且只能属于一个簇。
同一簇中的数据样本相似度高,不同簇中的数据样本相似度较小。
聚类相似度是利用各簇中样本的均值来进行计算的。
注:因为在该算法第一步中是随机的选取任意k个对象作为初始聚类的中心,初始地代表一个簇,因此k个初始类聚类中心点的选取对聚类结果具有较大的影响。
聚类步骤:
1)随机指定k个质心点(中心点)
2)根据距离分类(靠近质心点的划归为同一类)
3)采用平均值更新质心点
4)重复迭代步骤2-3,直到质心点不在变化或者达到指点具体迭代次数。
python代码实现
import numpy as np
import matplotlib.pyplot as plt
# 引入scipy中的距离函数,默认欧式距离
from scipy.spatial.distance import cdist
# 从sklearn中直接生成聚类数据
from sklearn.datasets._samples_generator import make_blobs
# -------------1. 数据加载---------
x, y = make_blobs(n_samples=100, centers=6, random_state=1234, cluster_std=0.6)
#plt.figure(figsize=(6, 6))
#plt.scatter(x[:, 0], x[:, 1], c=y)
#plt.show()
# --------------2. 算法实现--------------
class K_Means(object):
# 初始化,参数 n_clusters(K)、迭代次数max_iter、初始质心 centroids
def __init__(self, n_clusters=5, max_iter=300, centroids=[]):
self.n_clusters = n_clusters
self.max_iter = max_iter
self.centroids = np.array(centroids, dtype=np.float)
# 训练模型方法,k-means聚类过程,传入原始数据
def fit(self, data):
# 假如没有指定初始质心,就随机选取data中的点作为初始质心
if (self.centroids.shape == (0,)):
# 从data中随机生成0到data行数的6个整数,作为索引值
self.centroids = data[np.random.randint(0, data.shape[0], self.n_clusters), :]
# 开始迭代
for i in range(self.max_iter):
# 1. 计算距离矩阵,得到的是一个100*6的矩阵
distances = cdist(data, self.centroids)
# 2. 对距离按有近到远排序,选取最近的质心点的类别,作为当前点的分类
c_ind = np.argmin(distances, axis=1)
# 3. 对每一类数据进行均值计算,更新质心点坐标
for i in range(self.n_clusters):
# 排除掉没有出现在c_ind里的类别
if i in c_ind:
# 选出所有类别是i的点,取data里面坐标的均值,更新第i个质心
self.centroids[i] = np.mean(data[c_ind == i], axis=0)
# 实现预测方法
def predict(self, samples):
# 跟上面一样,先计算距离矩阵,然后选取距离最近的那个质心的类别
distances = cdist(samples, self.centroids)
c_ind = np.argmin(distances, axis=1)
return c_ind
dist = np.array([[121, 221, 32, 43],
[121, 1, 12, 23],
[65, 21, 2, 43],
[1, 221, 32, 43],
[21, 11, 22, 3], ])
c_ind = np.argmin(dist, axis=1)
print(c_ind)
x_new = x[0:5]
print(x_new)
print(c_ind == 2)
print(x_new[c_ind == 2])
np.mean(x_new[c_ind == 2], axis=0)
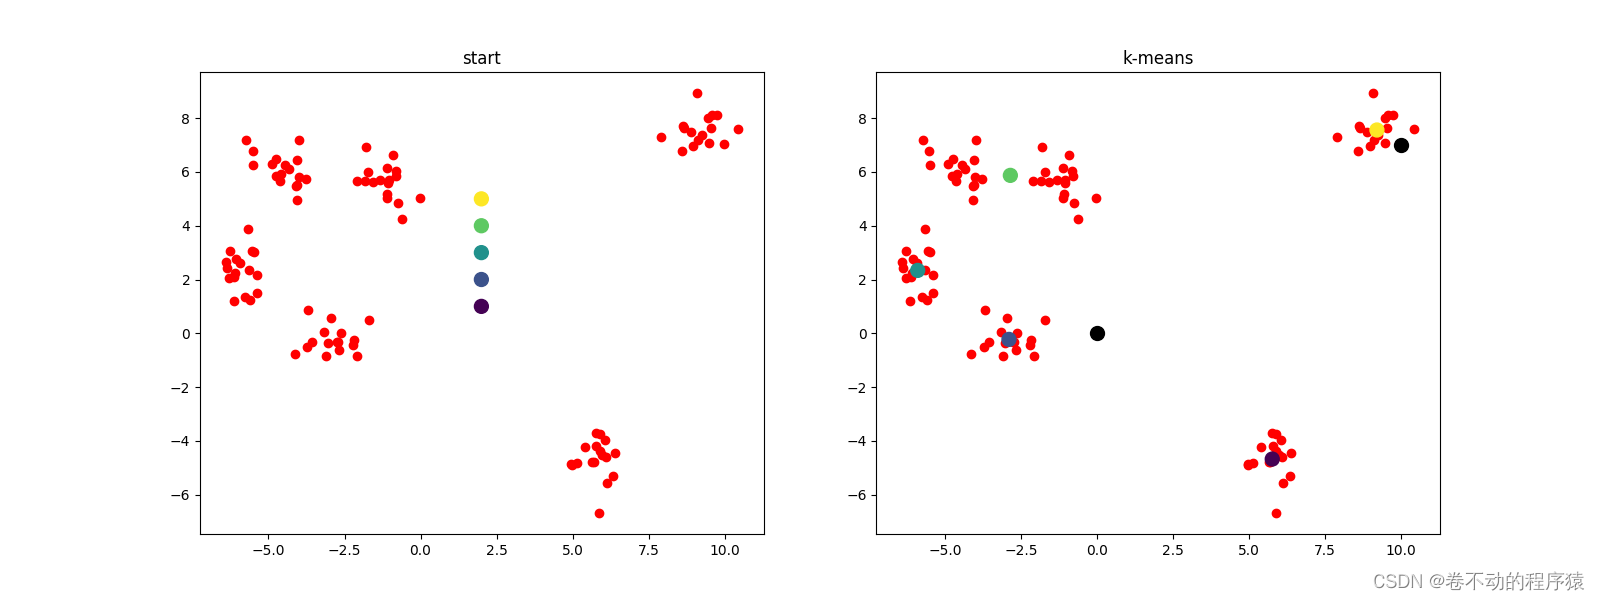
# --------------3. 测试------------
# 定义一个绘制子图函数
def plotKMeans(x, y, centroids, subplot, title):
# 分配子图,121表示1行2列的子图中的第一个
plt.subplot(subplot)
plt.scatter(x[:, 0], x[:, 1], c='cyan')
# 画出质心点
plt.scatter(centroids[:, 0], centroids[:, 1], c=np.array(range(5)), s=100)
plt.title(title)
kmeans = K_Means(max_iter=300, centroids=[[2, 1], [2, 2], [2, 3], [2, 4], [2, 5]])
plt.figure(figsize=(16, 6))
plotKMeans(x, y, kmeans.centroids, 121, 'start')
# 开始聚类
kmeans.fit(x)
plotKMeans(x, y, kmeans.centroids, 122, 'k-means')
# 预测新数据点的类别
x_new = np.array([[0, 0], [10, 7]])
y_pred = kmeans.predict(x_new)
print(kmeans.centroids)
print(y_pred)
plt.scatter(x_new[:, 0], x_new[:, 1], s=100, c='black')
plt.show()