文章目录
一、安装Prometheus
1、下载安装包
# 1 进入安装目录
cd /webapps
# 2 下载安装包
wget https://github.com/prometheus/prometheus/releases/download/v2.42.0/prometheus-2.42.0.linux-amd64.tar.gz
# 3 解压
tar -zxvf prometheus-2.42.0.linux-amd64.tar.gz
# 4 重命名
mv prometheus-2.42.0.linux-amd64 prometheus

# 5 创建软链接(可不执行)
ln -sv /webapps/prometheus /usr/local/prometheus
2、两种启动方式
2.1、方式一(无需开机启动)
不需要开机启动时,可以采用此方式
# 命令
nohup ./prometheus --config.file=./prometheus.yml &
# 或
nohup ./prometheus --config.file=prometheus.yml >> /webapps/prometheus/prometheus.out 2>&1 &
2.2、方式二(需开机启动)
需要开机自启动,采用此方式
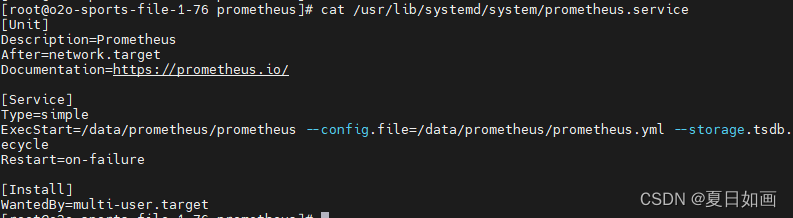
# 创建prometheus.service文件
vim /usr/lib/systemd/system/prometheus.service
# 配置内容
[Unit]
Description=Prometheus
After=network.target
Documentation=https://prometheus.io/

[Service]
Type=simple
ExecStart=/webapps/prometheus/prometheus --config.file=/webapps/prometheus/prometheus.yml --storage.tsdb.path=/webapps/prometheus/data --web.listen-address=:9090 --web.enable-lifecycle
Restart=on-failure

[Install]
WantedBy=multi-user.target
# 重新加载服务文件
systemctl daemon-reload
# 设置开机自启
systemctl enable prometheus
# 启动prometheus
systemctl start prometheus
# 查看prometheus状态
systemctl status prometheus

# 查看服务是否启动
lsof -i:9090
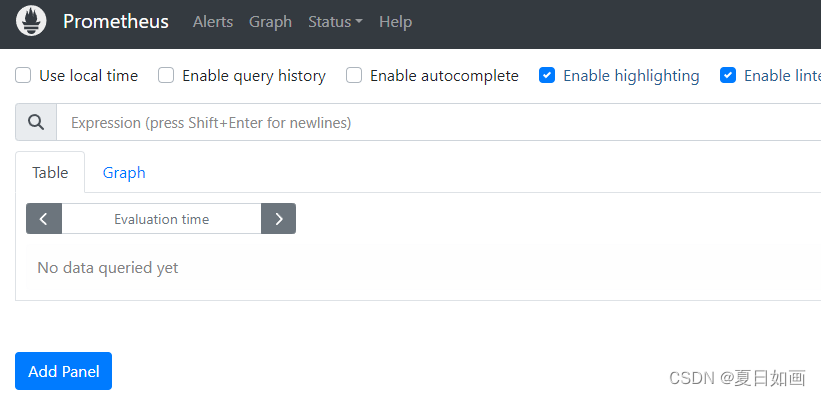
3、访问
# URL
http://自己的IP:9090
二、安装Grafana
1、下载安装包
# 1 进入安装目录
cd /webapps
# 2 下载安装包
wget https://dl.grafana.com/oss/release/grafana-9.4.3.linux-amd64.tar.gz
# 3 解压
tar -zxvf grafana-9.4.3.linux-amd64.tar.gz
# 4 重命名
mv grafana-9.4.3 grafana
2、两种启动方式
2.1、方式一(无需开机启动)
不需要开机启动时,可以采用此方式
# 进入目录
cd /webapps/grafana/bin/
# 命令
./grafana-server start &
# 或
nohup ./prometheus --config.file=prometheus.yml >> /webapps/prometheus/prometheus.out 2>&1 &
2.2、方式二(需开机启动)
需要开机自启动,采用此方式
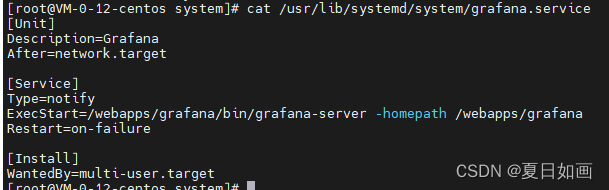
# 创建grafana.service文件
vim /usr/lib/systemd/system/grafana.service
# 配置内容
[Unit]
Description=Grafana
After=network.target

[Service]
Type=notify
ExecStart=/webapps/grafana/bin/grafana-server -homepath /webapps/grafana
Restart=on-failure

[Install]
WantedBy=multi-user.target
# 重新加载服务文件
systemctl daemon-reload
# 设置开机自启
systemctl enable grafana
# 启动grafana
systemctl start grafana
# 查看grafana状态
systemctl status grafana

# 查看服务是否启动
lsof -i:3000
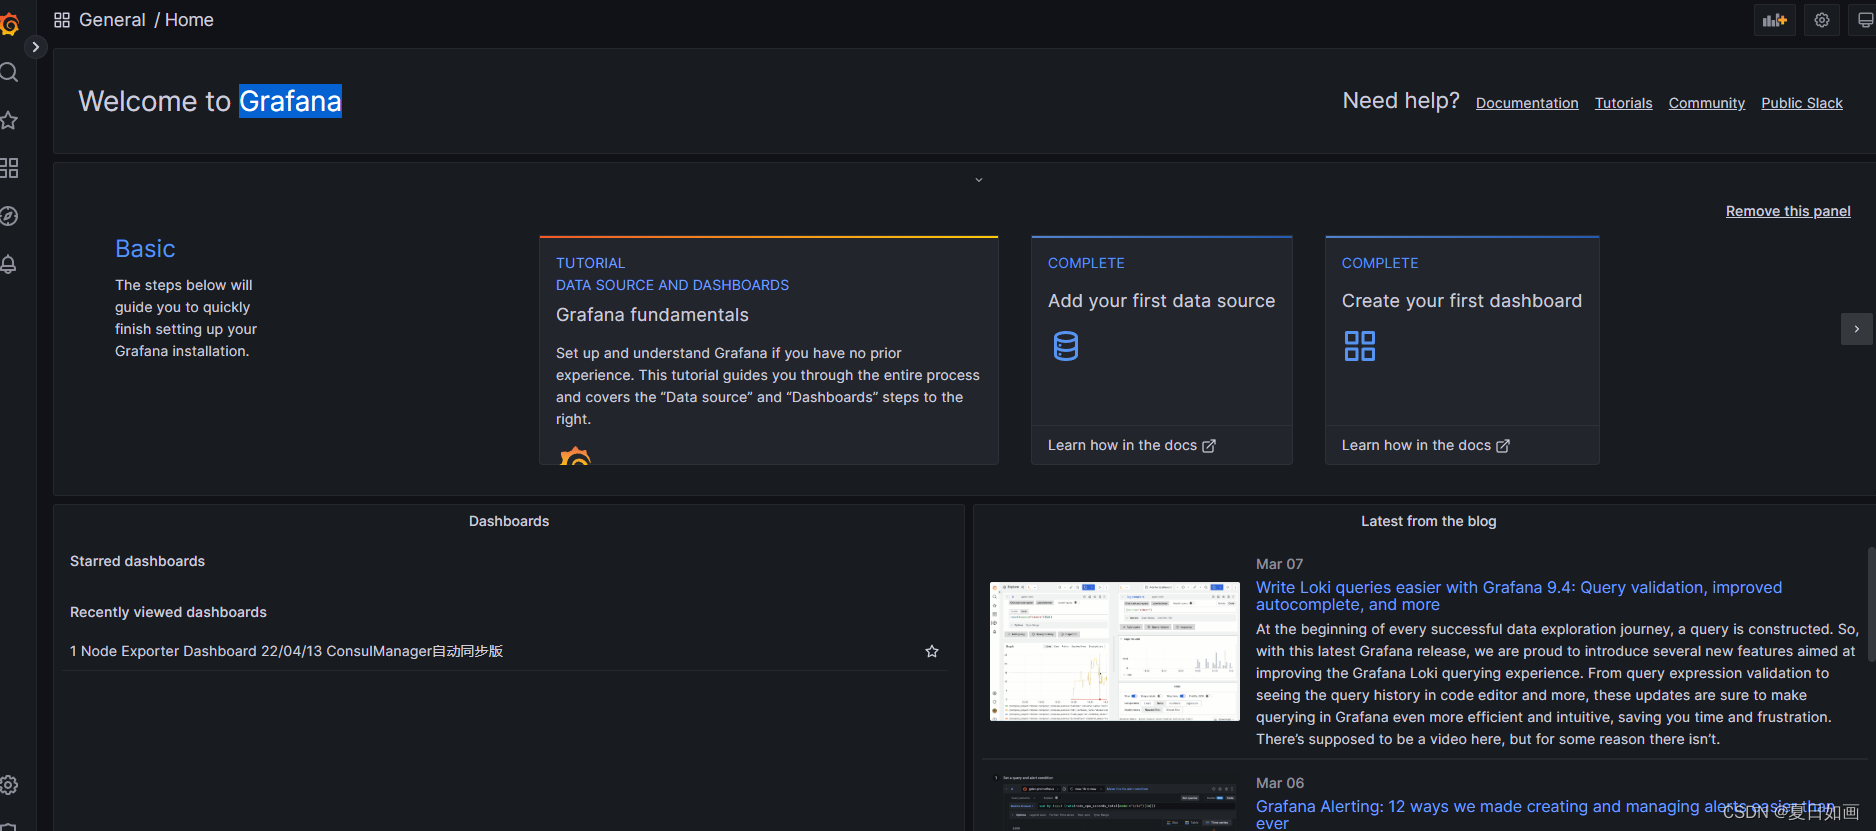
3、访问
# URL
http://自己的IP:3000
# 用户名密码
admin admin
三、安装node_exporter并配置
监控linux服务器的cpu、内存、磁盘等信息。
流程:
node_exporter 采集指标
prometheus 从exporter拉取指标保存起来
grafana 从prometheus查询数据,可视化展示
1、下载安装包
# 1 进入安装目录
cd /webapps
# 2 下载安装包
wget https://github.com/prometheus/node_exporter/releases/tag/v1.5.0/node_exporter-1.5.0.linux-amd64.tar.gz
# 3 解压
tar -zxvf node_exporter-1.5.0.linux-amd64.tar.gz
# 4 重命名
mv node_exporter-1.5.0.linux-amd64 node_exporter
2、启动
这里只说明了无需开机自启动的方式,开机自动的配置方式与上面的类似。
# 进入目录
cd /webapps/node_exporter
# 命令
nohup ./node_exporter &
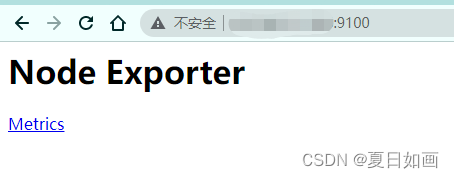
3、访问
# URL
http://自己的IP:9100
4、修改prometheus配置
# 编辑prometheus配置文件
vim /webapps/prometheus/prometheus.yml
# 配置内容
# my global config
global:
  scrape_interval: 15s # Set the scrape interval to every 15 seconds. Default is every 1 minute.
  evaluation_interval: 15s # Evaluate rules every 15 seconds. The default is every 1 minute.
  # scrape_timeout is set to the global default (10s).

# Alertmanager configuration
alerting:
  alertmanagers:
    - static_configs:
        - targets:
          # - alertmanager:9093

# Load rules once and periodically evaluate them according to the global 'evaluation_interval'.
rule_files:
  # - "first_rules.yml"
  # - "second_rules.yml"

# A scrape configuration containing exactly one endpoint to scrape:
# Here it's Prometheus itself.
scrape_configs:
  # The job name is added as a label `job=<job_name>` to any timeseries scraped from this config.
  - job_name: "prometheus"

    # metrics_path defaults to '/metrics'
    # scheme defaults to 'http'.

    static_configs:
      - targets: ["localhost:9090"]
#新增
  - job_name: 'linux'
    static_configs:
      - targets: ['xx.xx.xx.xx:9100']         #被监控端服务器ip
        labels:
          instance: node1
# 监控目标的label(这里的监控目标只是一个metric,而不是指某特定主机,可以在特定主机取多个监控目标),在抓取的每条时间序列表中都会添加此label
修改完配置后,重启prometheus服务配置才生效
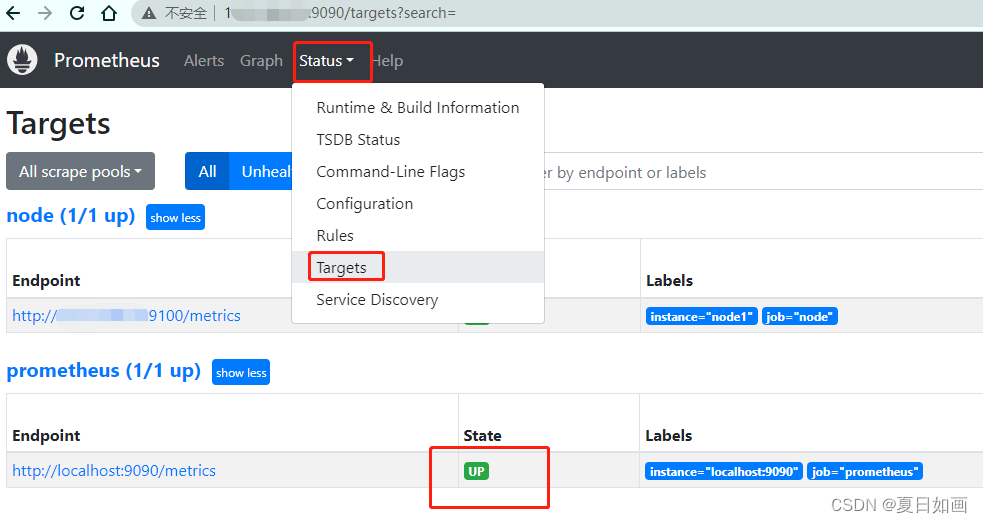
5、验证配置是否成功
进入:http://自己的IP:9090
status是up证明配置成功。
四、配置
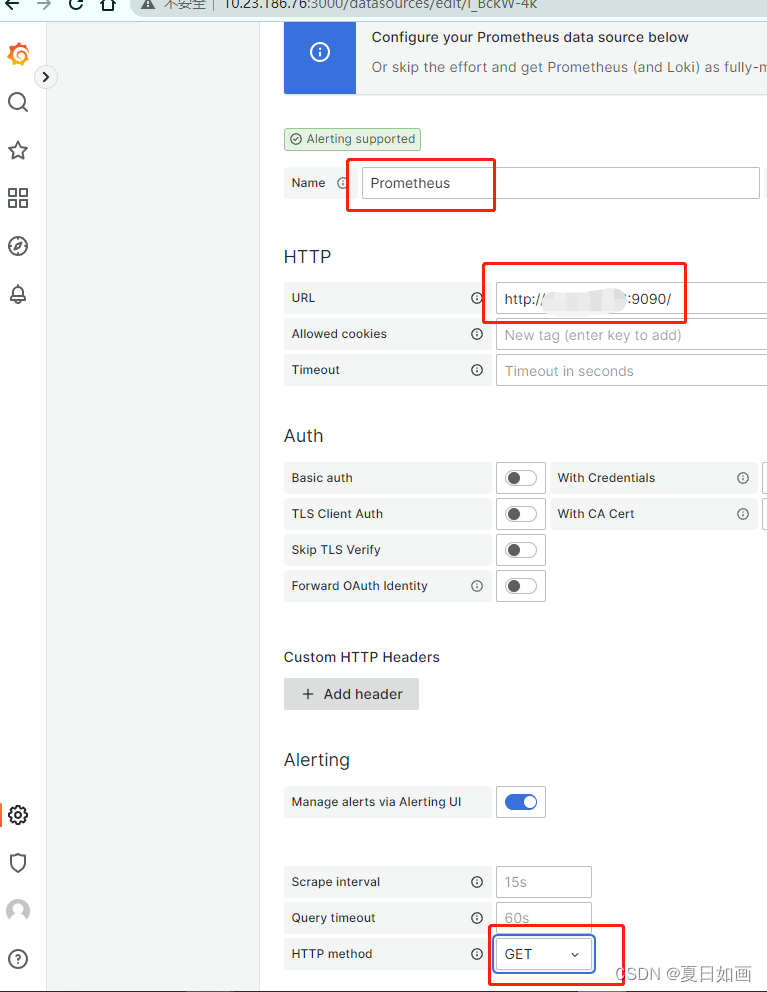
1、配置数据源
1.1、添加Data source,选择prometheus
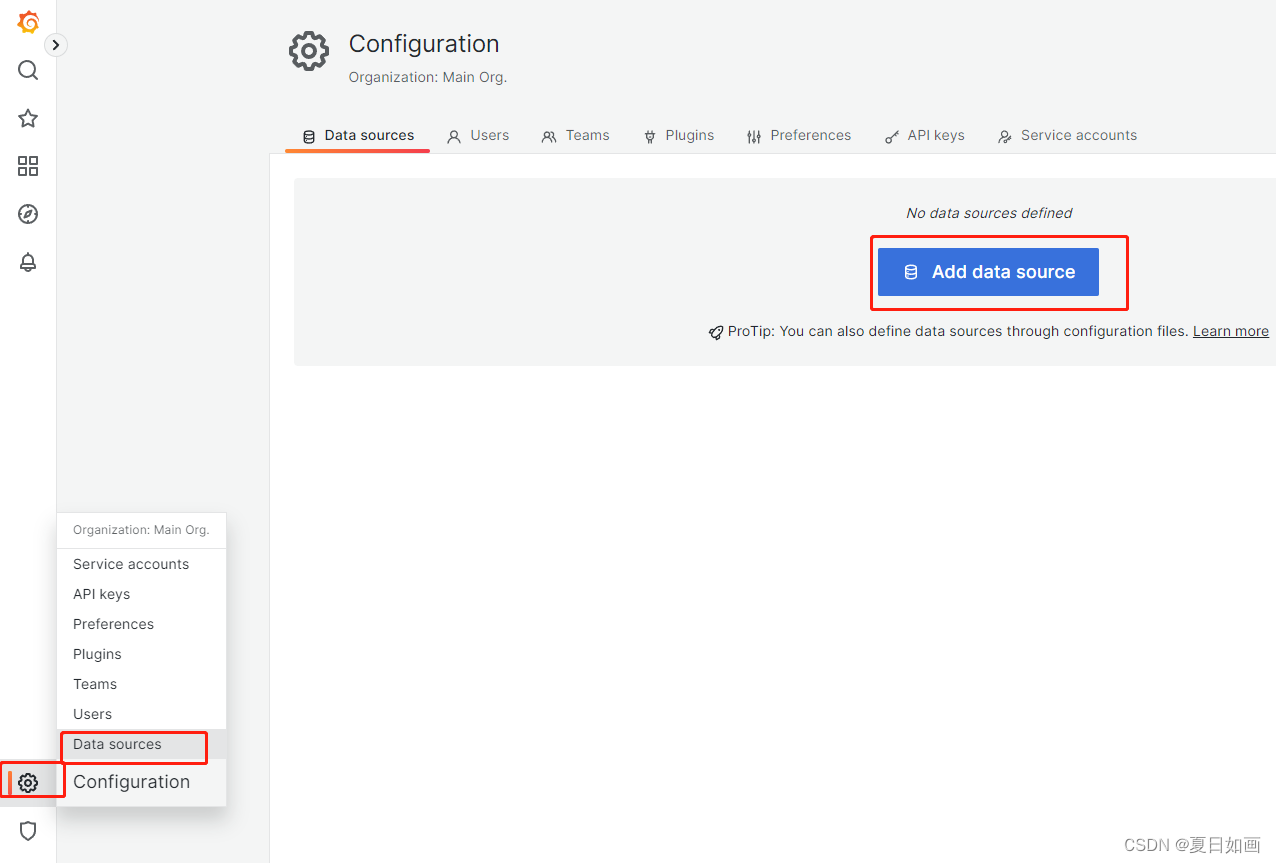
1.2、输入name、url等,保存即可
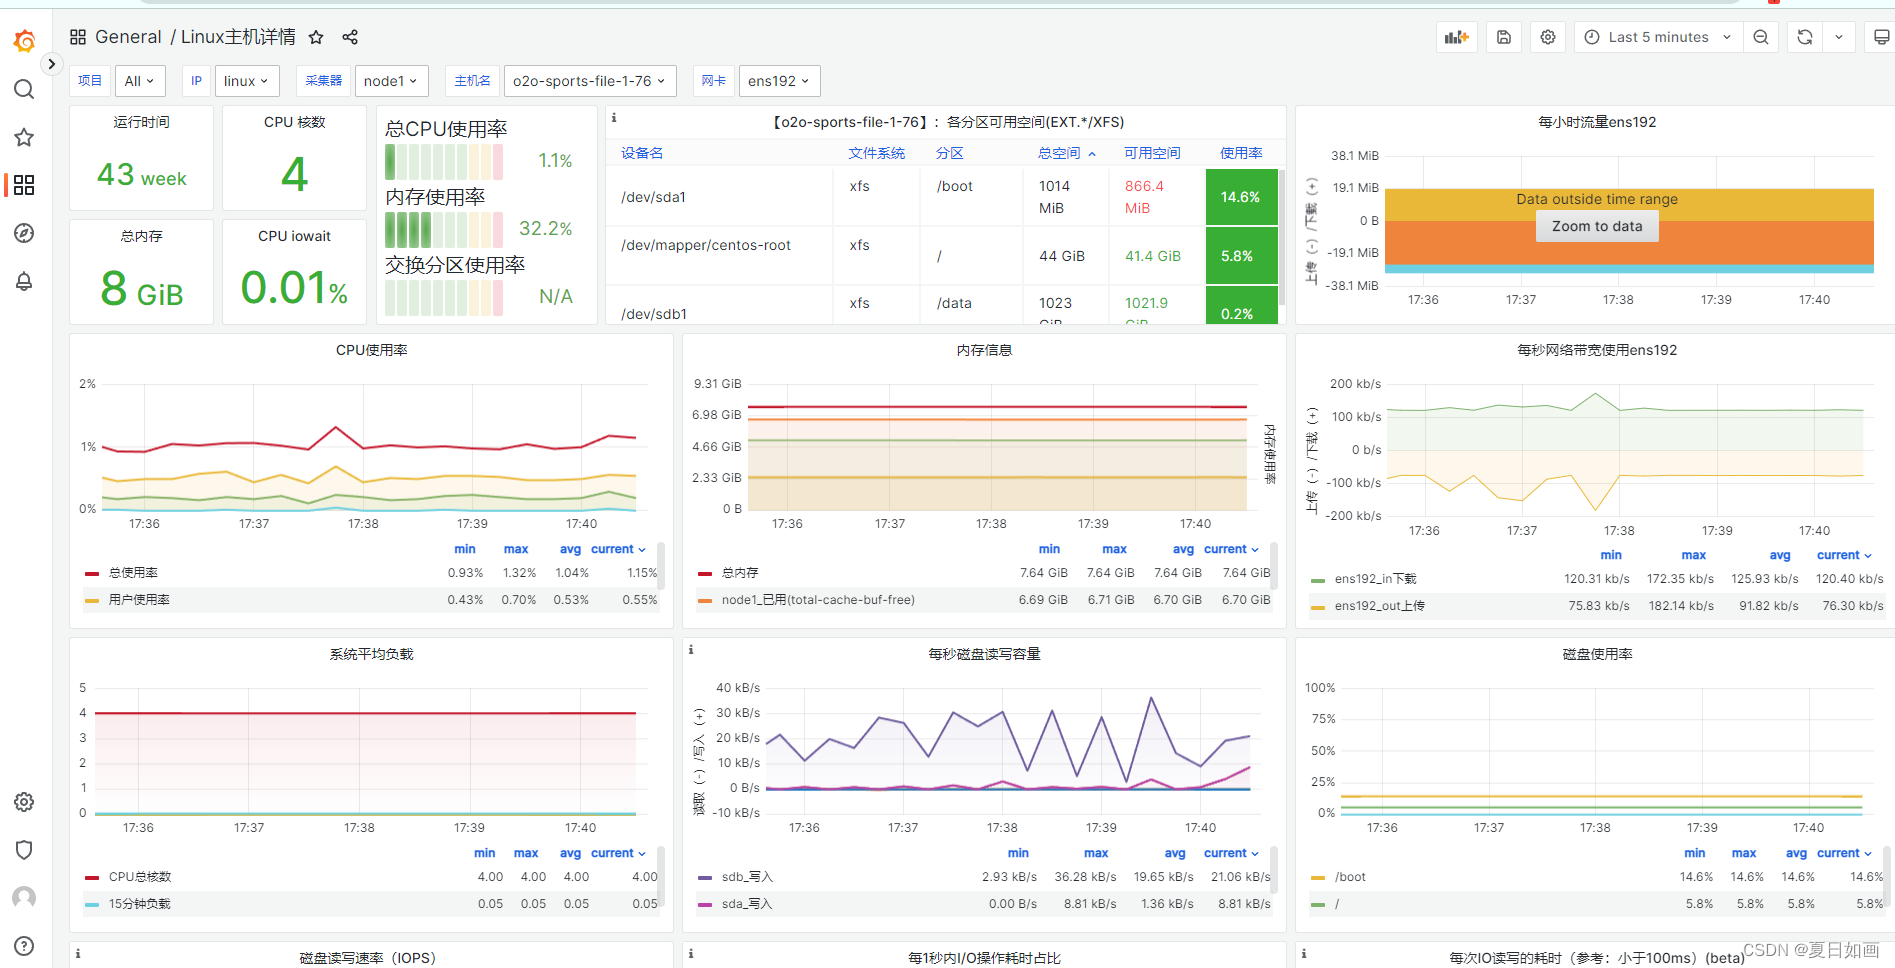
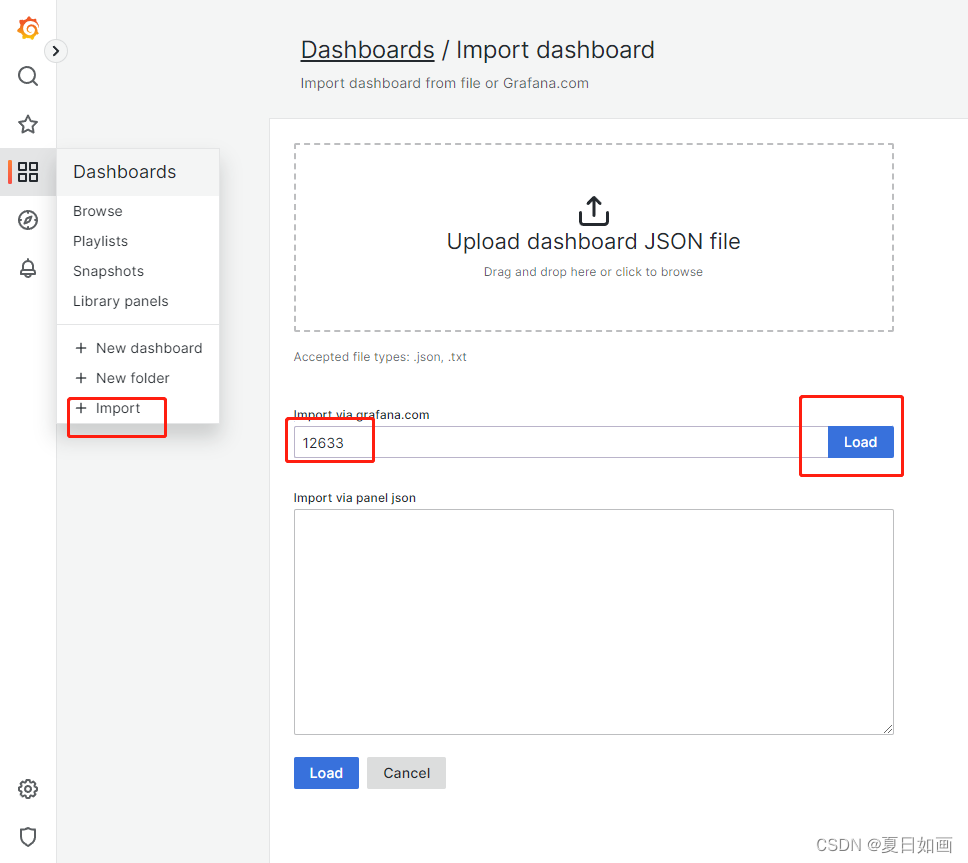
2、添加仪表盘
输入ID,点击load。
ID是Grafana官方提供的
Dashboard网站 https://grafana.com/grafana/dashboards/
选择数据源,点击 import
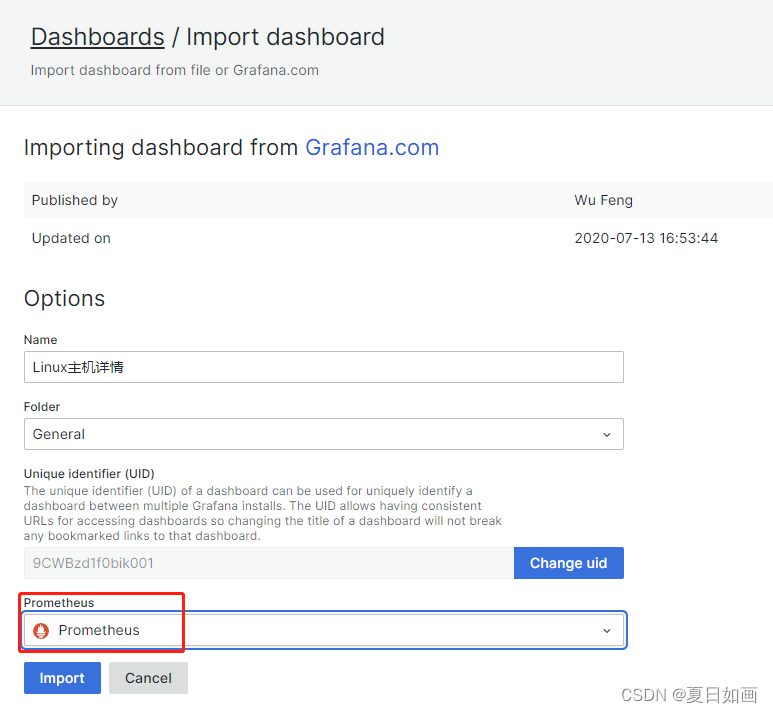
跳转到仪表盘界面