概述:
国内用Nginx的比较多,Nginx的监控比较老的方案可能是通过跑脚本定期收集nginx的status模块的数据,或者监控nginx的日志;后来阿里的tengine在国内开始流行,于是诞生了很多不错的lua模块;但是这些监控方案在有新的监控需求的时候,可能就需要再修改脚本或者更改nginx conf配置,有时候不是特别的方便。用Prometheus进行nginx的监控可以自动的对相关server_name和upstream进行监控,你也可以自定义Prometheus的数据标签,实现对不同机房和不同项目的nginx进行监控。
监控Nginx主要用到以下三个模块:
nginx-module-vts:Nginx virtual host traffic status module,Nginx的监控模块,能够提供JSON格式的数据产出。
nginx-vts-exporter:Simple server that scrapes Nginx vts stats and exports them via HTTP for Prometheus consumption。主要用于收集Nginx的监控数据,并给Prometheus提供监控接口,默认端口号9913。
Prometheus:监控Nginx-vts-exporter提供的Nginx数据,并存储在时序数据库中,可以使用PromQL对时序数据进行查询和聚合
1.nginx-module-vts模块编译
nginx_vts_exporter依赖nginx-module-vts模块,安装此模块无需任何其他依赖。模块与Nginx的版本兼容性如下:
1.11.x (last tested: 1.11.10)
1.10.x (last tested: 1.10.3)
1.8.x (last tested: 1.8.0)
1.6.x (last tested: 1.6.3)
1.4.x (last tested: 1.4.7)
同时适用于tengine,其他nginx早期版本未做验证。
安装步骤
1.1下载模块
cd /server/tool/prometheus
git clone git://github.com/vozlt/nginx-module-vts.git
1.2 .编译配置
在nginx编译时添加vts模块
--add-module=/path/to/nginx-module-vts查看nginx编译模块
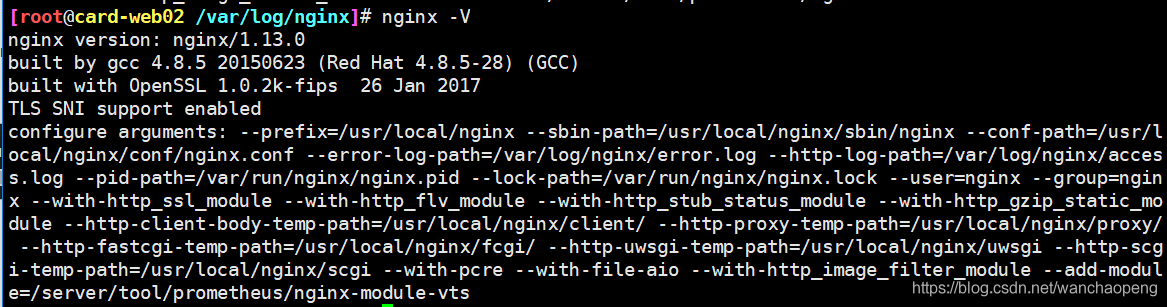
加入需要安装的模块,重新编译,如这里添加–add-module=/root/mapr/nginx-module-vts
./configure --prefix=/usr/local/nginx --sbin-path=/usr/local/nginx/sbin/nginx --conf-path=/usr/local/nginx/conf/nginx.conf --error-log-path=/var/log/nginx/error.log --http-log-path=/var/log/nginx/access.log --pid-path=/var/run/nginx/nginx.pid --lock-path=/var/run/nginx/nginx.lock --user=nginx --group=nginx --with-http_ssl_module --with-http_flv_module --with-http_stub_status_module --with-http_gzip_static_module --http-client-body-temp-path=/usr/local/nginx/client/ --http-proxy-temp-path=/usr/local/nginx/proxy/ --http-fastcgi-temp-path=/usr/local/nginx/fcgi/ --http-uwsgi-temp-path=/usr/local/nginx/uwsgi --http-scgi-temp-path=/usr/local/nginx/scgi --with-pcre --with-file-aio --with-http_image_filter_module --add-module=/server/tool/prometheus/nginx-module-vtsmake编译 不要make install, 不然会覆盖
替换nginx二进制文件
cp ./objs/nginx /usr/local/nginx/sbin/修改配置文件
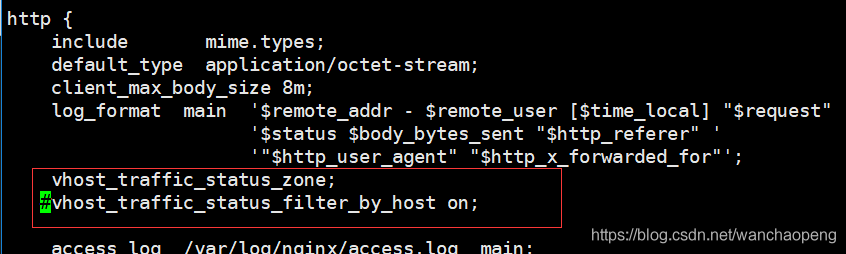

重新加载nginx配置

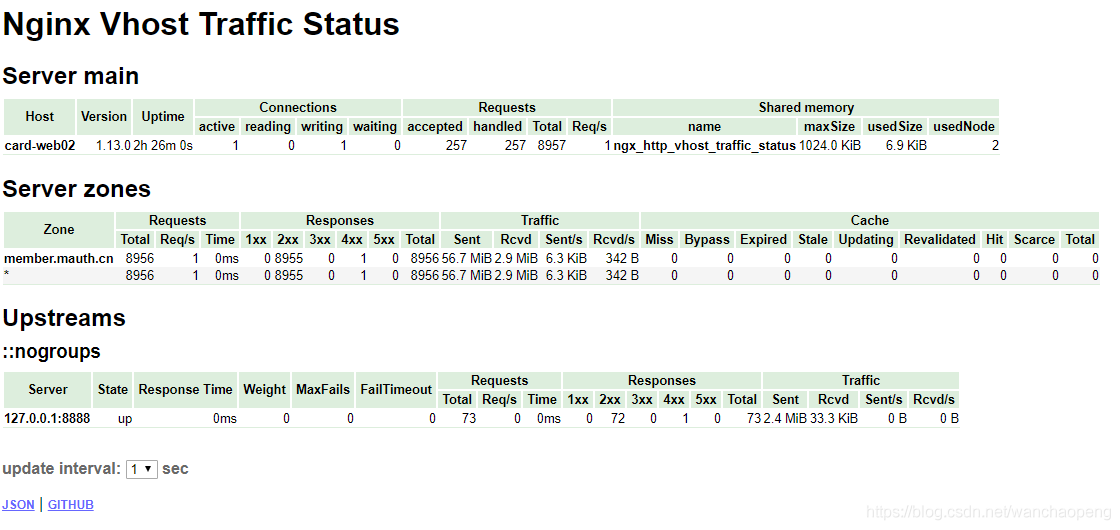
访问http://IP/status出现数据页面
2. 安装nginx-vts-exporter
exporter会收集nginx性能指标的JSON格式数据,并汇总后暴露监控接口给Prometheus。
2.1 下载安装
wget -c https://github.com/hnlq715/nginx-vts-exporter/releases/download/v0.9.1/nginx-vts-exporter-0.9.1.linux-amd64.tar.gz
或
wget -O nginx-vts-exporter-0.5.zip https://github.com/hnlq715/nginx-vts-exporter/archive/v0.5.zip
安装
tar xf nginx-vts-exporter-0.9.1.linux-amd64.tar.gz -C /server/prometheus/
2.2 后台运行
/server/prometheus/nginx-vts-exporter-0.9.1.linux-amd64/nginx-vts-exporter -nginx.scrape_timeout 10 -nginx.scrape_uri https://IP/status/format/json推荐exporter和nginx安装在同一台机器上,如果不在同一台主机,把scrape_uri改为nginx主机的地址。nginx_vts_exporter的默认端口号:9913,对外暴露监控接口http://xxx:9913/metrics.
2.2.1 配置systemd服务
 vim /etc/systemd/system/nginx_vts_exporter.service

[Unit]
Description=nginx_exporter
After=network.target
[Service]
Type=simple
User=prometheus
ExecStart=/server/prometheus/nginx-vts-exporter-0.9.1.linux-amd64/nginx-vts-exporter  -nginx.scrape_uri=https://IP/status/format/json
Restart=on-failure
[Install]
WantedBy=multi-user.target
2.2.2 启动nginx-vts-expoerter
systemctl start nginx-vts-exporter.service
systemctl status nginx-vts-exporter.service
2.3 修改peometheus.yml, 加入下面的监控目标:
nginx-vts-exporter默认的抓取地址为http://IP:9913/metrics
$ vim  /server/prometheus/prometheus.yml
  - job_name: nginx
    static_configs:
      - targets: ['192.168.2.210:9913']
        labels:
          instance: card-web02
重启prometheus
$ systemctl restart prometheus
3.导入nginx stats 模板
由于是官方平台提供的模板,直接在导入页面填入模板id即可导入


- 访问Dashboards
在Dashboards上选Nginx Stats模板,就可以看到被监控Nginx服务器的各项状态。
