Grafana+Prometheus的安装请参考Grafana+Prometheus+Pushgateway三剑客安装_那些乐趣的博客-CSDN博客博文
1:首先在需要监控的linux服务器上安装node_exporter,可以直接通过wget的方式安装,也可以下载后导入安装,
下载地址:https://github.com/prometheus/node_exporter/releases

wget安装:wget  https://github.com/prometheus/node_exporter/releases/download/v1.3.1/node_exporter-1.3.1.linux-amd64.tar.gz


解压node_exporter
tar -zxf node_exporter-1.0.1.linux-386.tar.gz


进入解压后文件夹执行  我这边是后台启动方法
nohup ./node_exporter &


使用docker也可以安装,安装方式如下:
docker run -d  --name node_exporter -p 9100:9100 -v "/proc:/host/proc:ro" -v "/sys:/host/sys:ro" -v "/:/rootfs:ro" prom/node-exporter
2:页面输入http://xx.xx.xx.xx:9100/metrics,可以访问,即安装成功。
3:在Prometheus配置文件prometheus.yml中配置需要监控的linux服务器的信息,job_name随便填,多个job_name时,注意不能重复,targets为监控服务器的node_moude地址
- job_name: 'jobname'
    static_configs:
    - targets: ['xx.xx.xx.xx:9100']
      labels:
        instance: 'xx.xx.xx.xx'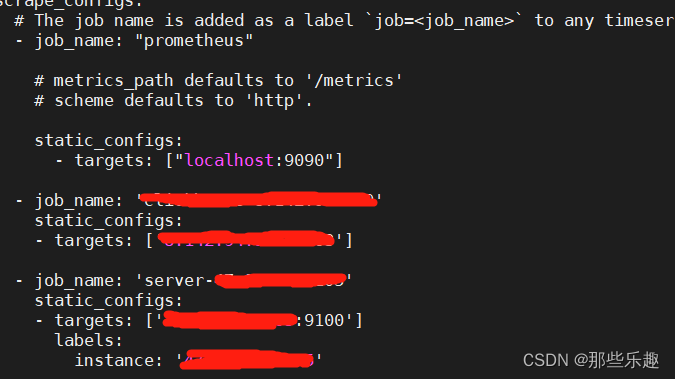
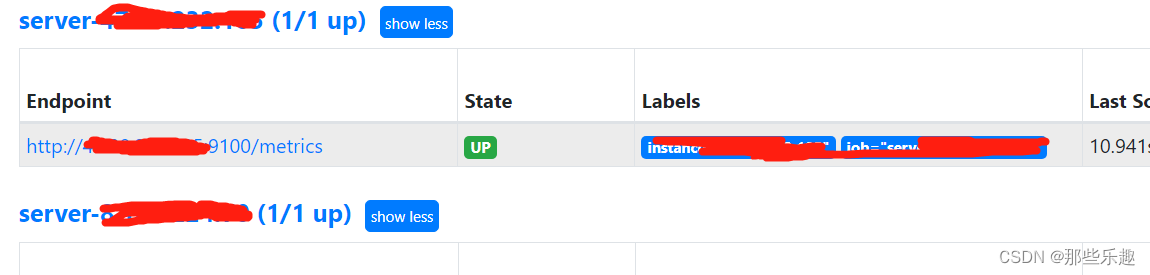
4:重启Prometheus,访问Prometheus地址,如果能看到配置的服务器状态为up即监控成功。
5:Grafana添加数据模板,在Dashboards | Grafana Labs搜索Node Exporter找到符合自己的数据模板,下载json文件导入到Grafana或者通过id的方式加载导入。
