一、安装prometheus:
下载相应的版本 :https://prometheus.io/download/
解压:
Linux:tar -zxvf XXX.tar.gz
windows:直接下载.ism 安装程序
mac:未使用过
进入到解压后的文件夹可以直接运行:
./prometheus --config.file=prometheus.yml
浏览器打开“http://localhost:9090” 访问

二、配置启动项
方法1 直接在prometheus.yml进行配置(监控内容较少的时候):
  - job_name: 'linux'
    static_configs:
    - targets: ['localhost:9104']
方法2 指定配置文件 :
# prometheus.yml 配置
  - job_name: 'Linux'
    file_sd_configs:
    - files: ['/opt/prometheus/sd_cfg/Linux.yml']
# /opt/prometheus/sd_cfg/Linux.yml 中文件配置
- targets: ['IP地址:9100']
  labels:
    name: Linux-node1[这里建议给每个主机打个有意义的标签,方便识别.]
配置文件检查命令(检查配置是否存在错误):
./promtool check config prometheus.yml
配置文件详解:
官方文档:https://prometheus.io/docs/prometheus/latest/configuration/configuration/
其他:
https://www.cnblogs.com/liujiliang/p/10080849.html
https://www.cnblogs.com/xiangsikai/p/11288835.html
创建专用用户:
groupadd prometheus
useradd -g prometheus -m -d /opt/prometheus/ -s /sbin/nologin prometheus
二、配置 Linux系统监控
node_exporter 服务安装:
下载地址:https://github.com/prometheus/node_exporter/releases/
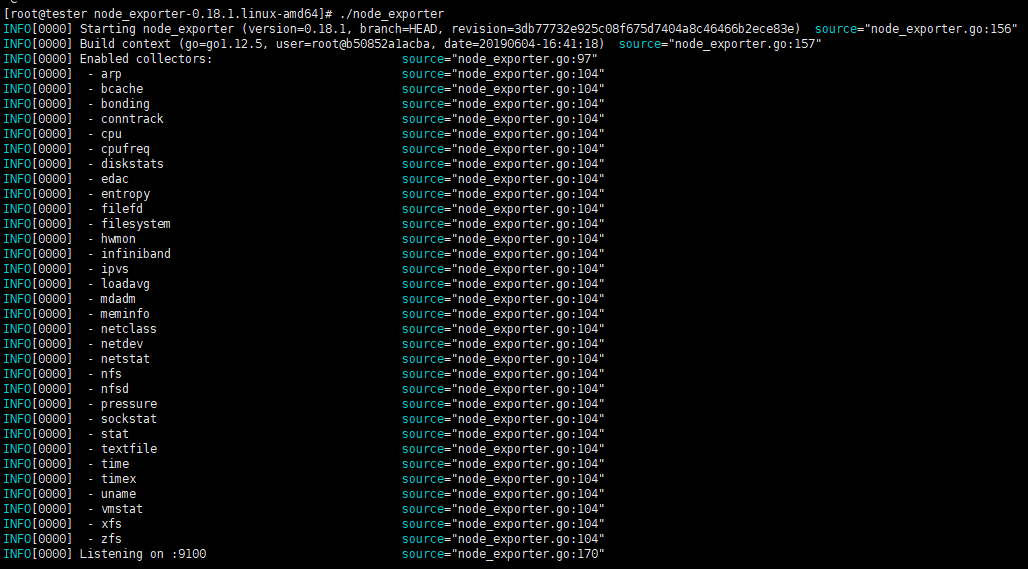
解压命令:tar -zxvf node_exporter-xxx.tar.gz

解压完成 进入解压文件夹: cd node_exporter-xxx

启动: ./node_exporter
成功效果
三、安装配置Grafana
下载地址:https://grafana.com/grafana/download
安装编译:yum localinstall grafana-xxx.rpm
安装完成访问 : http://localhost:3000
默认账号/密码:admin/admin

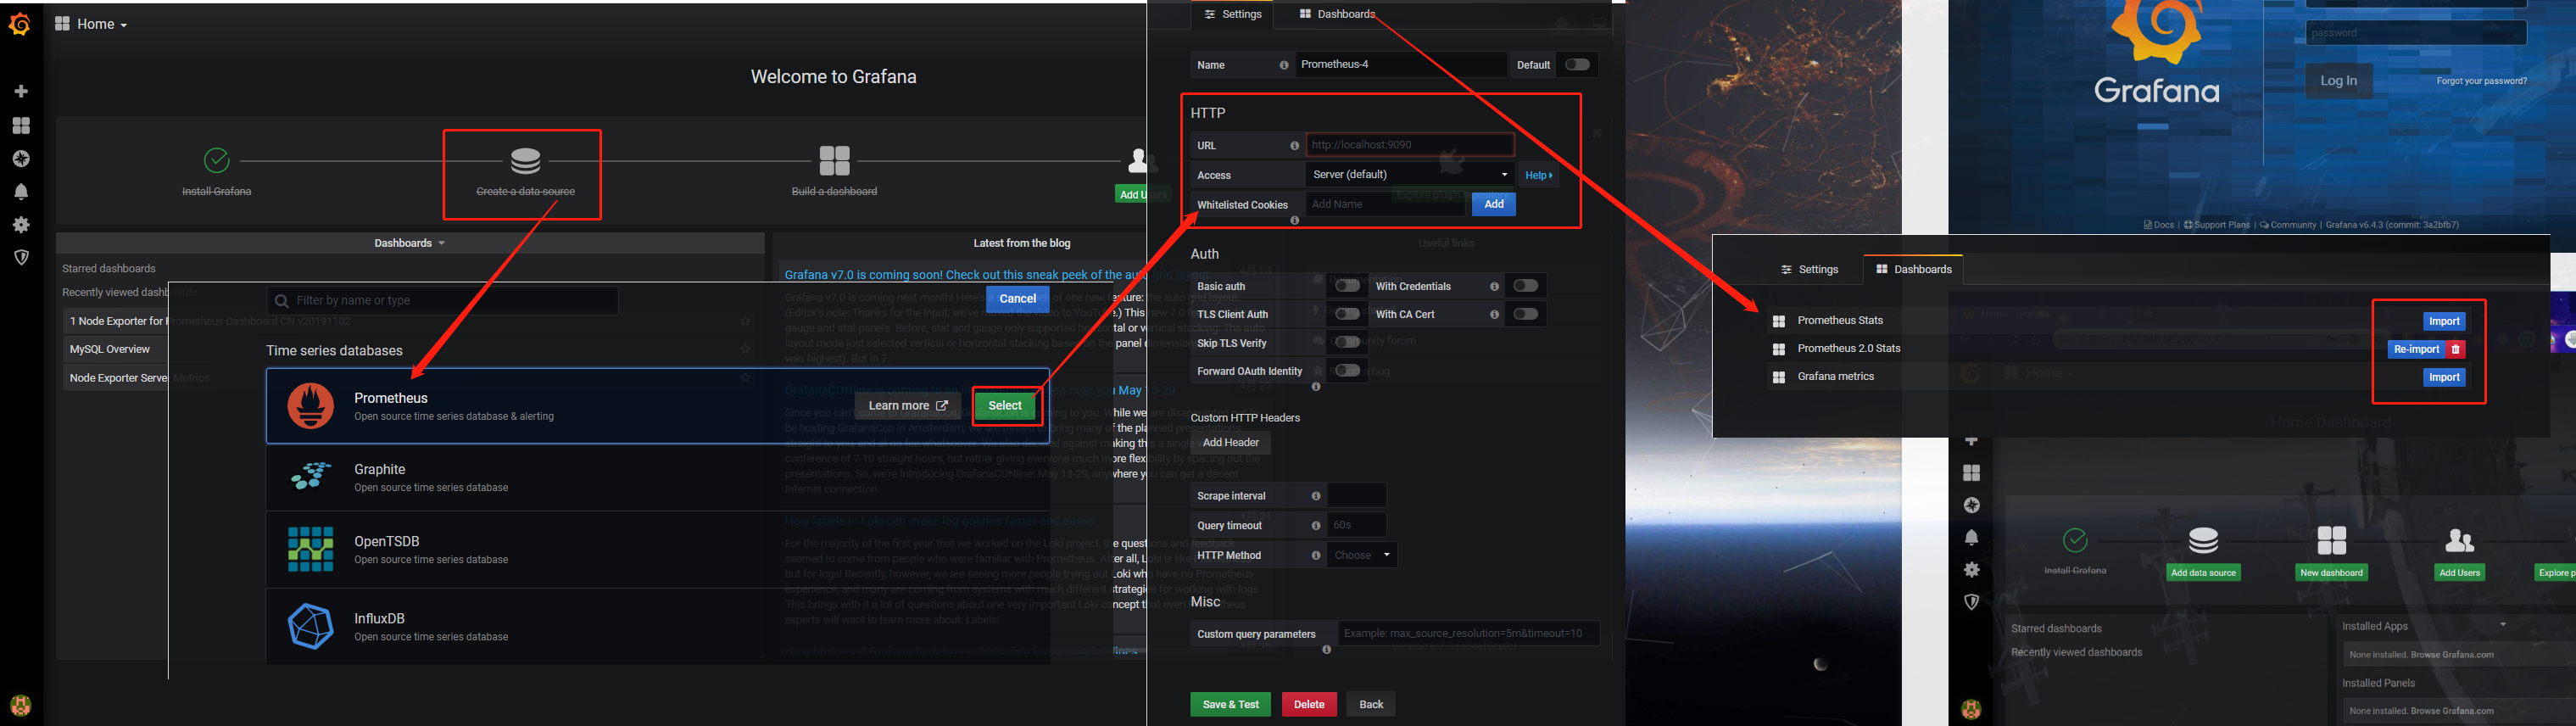
配置 node_exporter监控:
网址和服务名称填写就可以了。
添加统计图模板:
模板网址:https://grafana.com/grafana/dashboards
找到模板ID
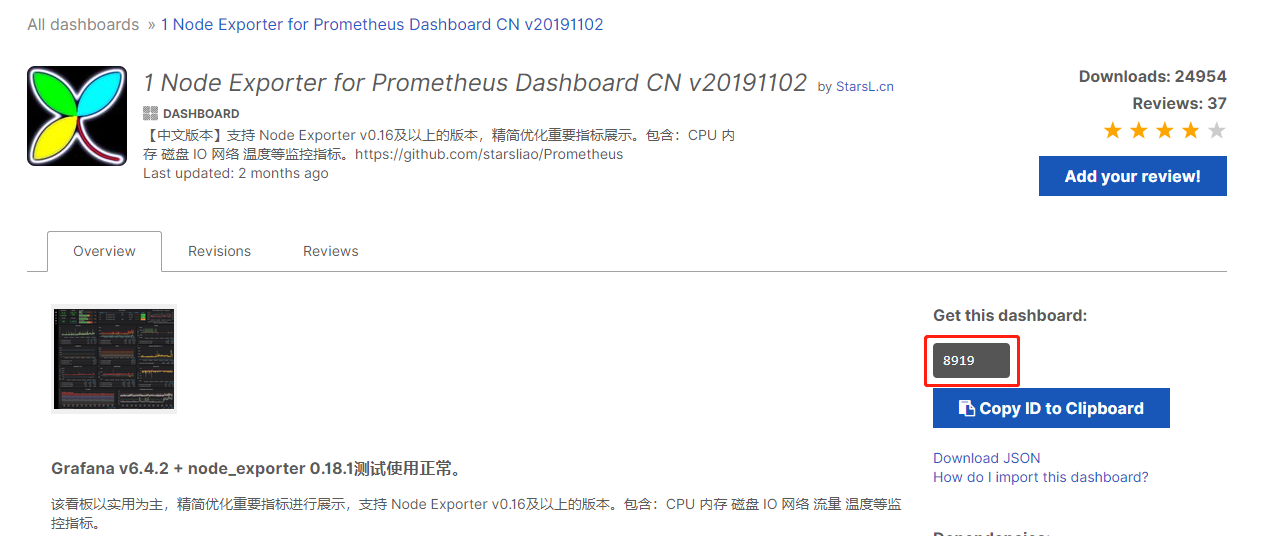
填写模板ID
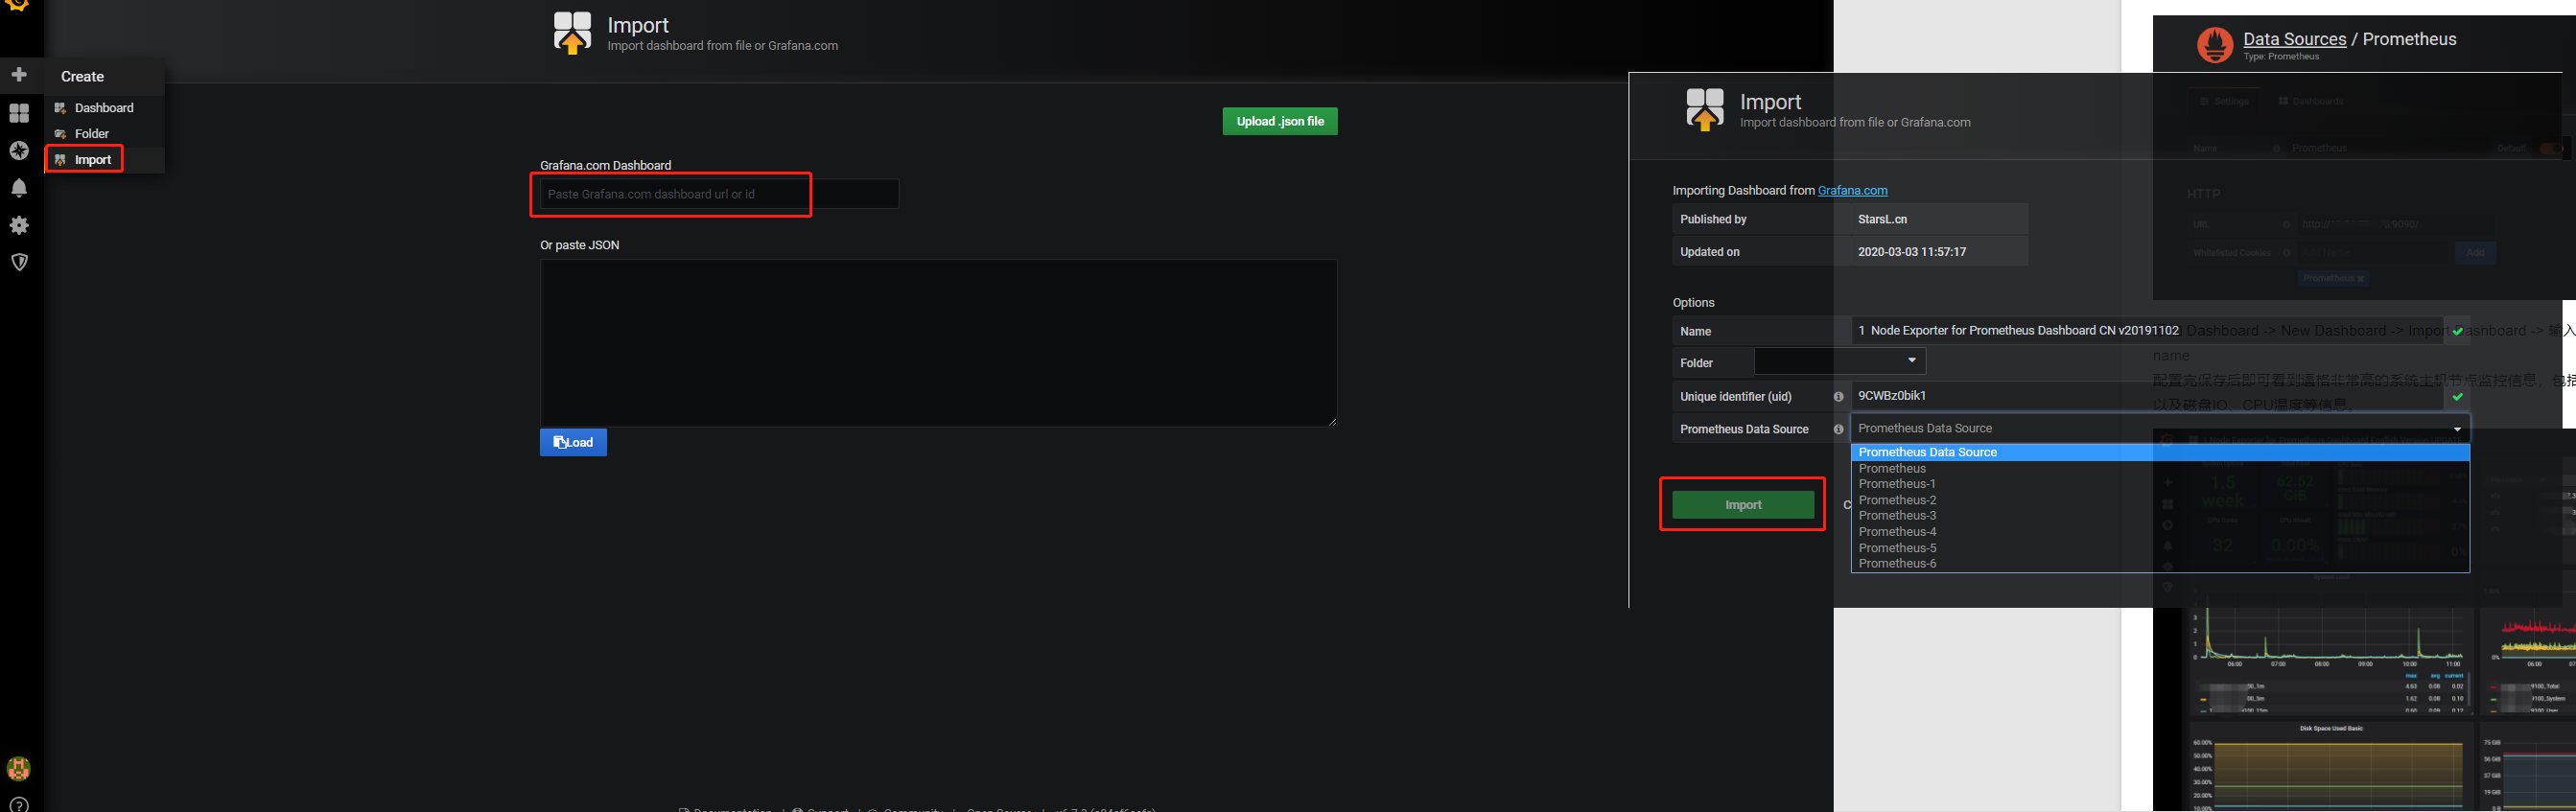
效果:
