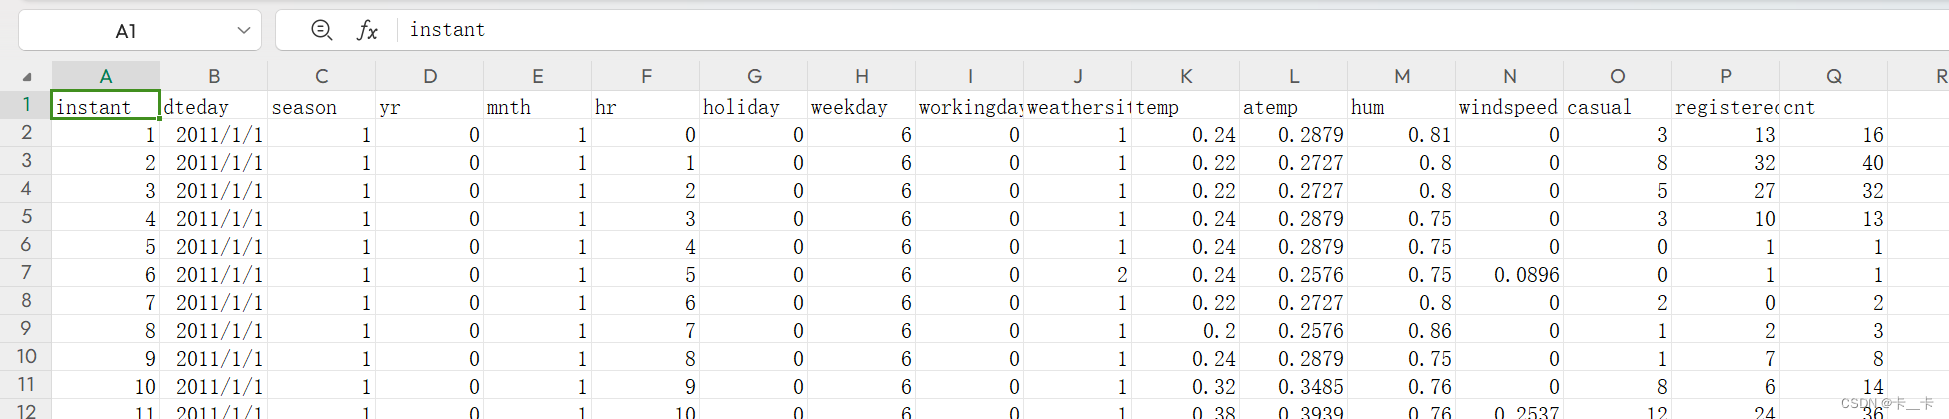
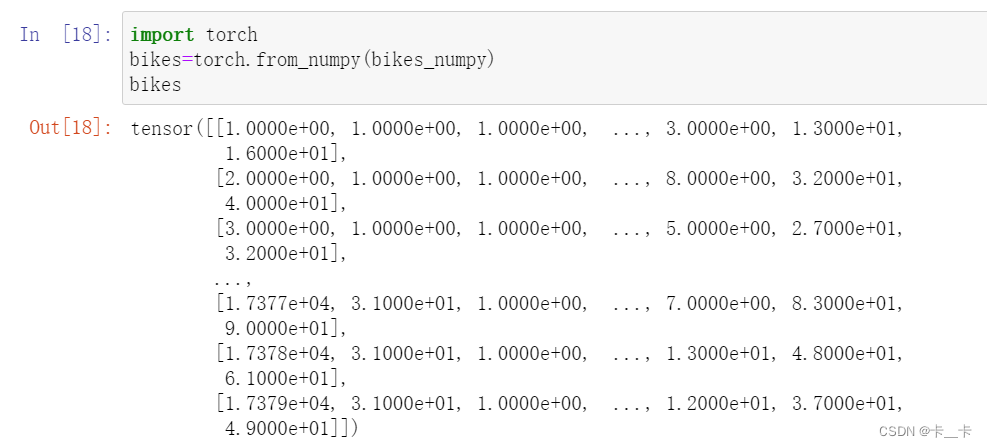
Data from a Washington, D.C., bike-sharing system reporting the hourly count of rental bikes in 2011–2012 in the Capital Bikeshare system, along with weather and seasonal information.
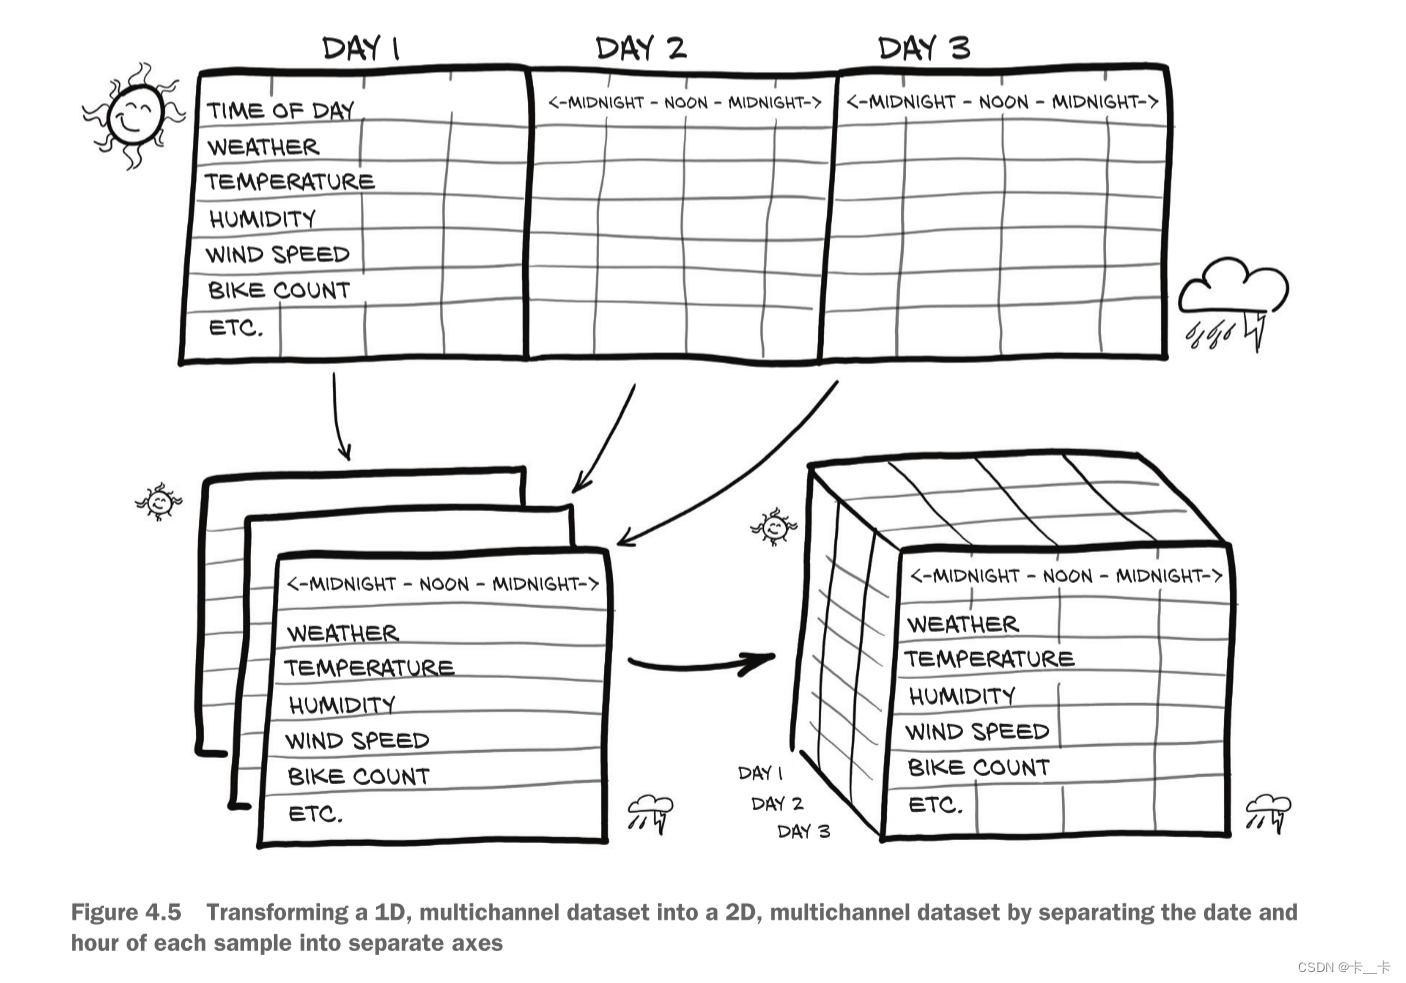
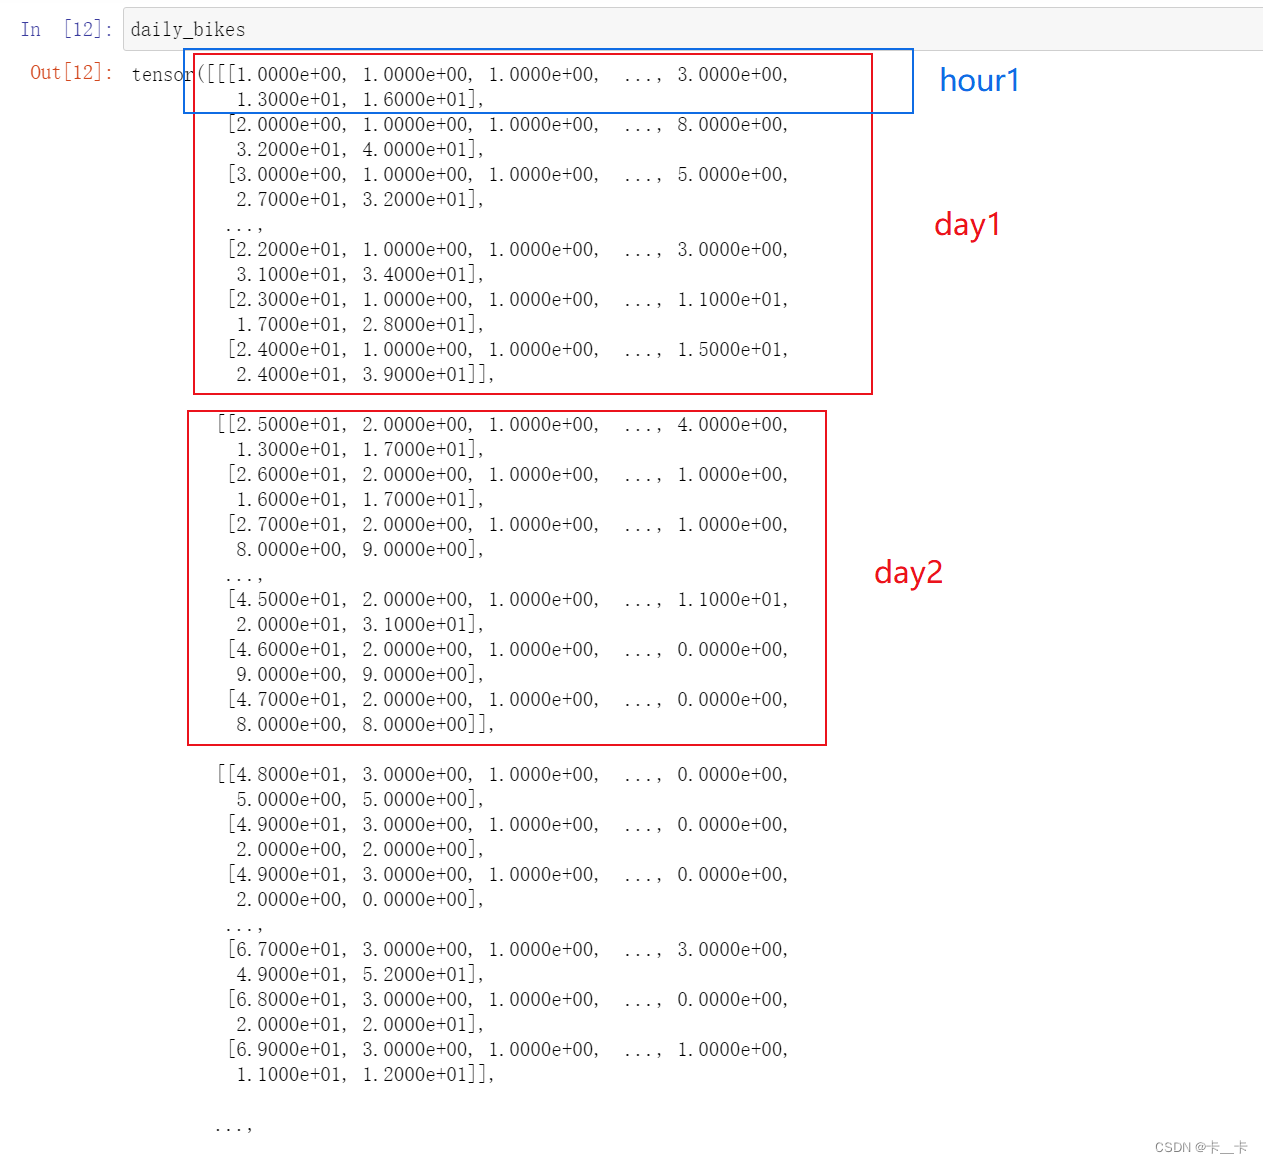
Our goal will be to take a flat, 2D dataset and transform it into a 3D one, as shown in figure 4.5.
(figure 4.5 shows a transposed version of this to better fit on the printed page)
We want to change the row-per-hour organization so that we have one axis that increases at a rate of one day per index increment, and another axis that represents the hour of the day (independent of the date). The third axis will be our different columns of data (weather, temperature, and so on).
import numpy as np
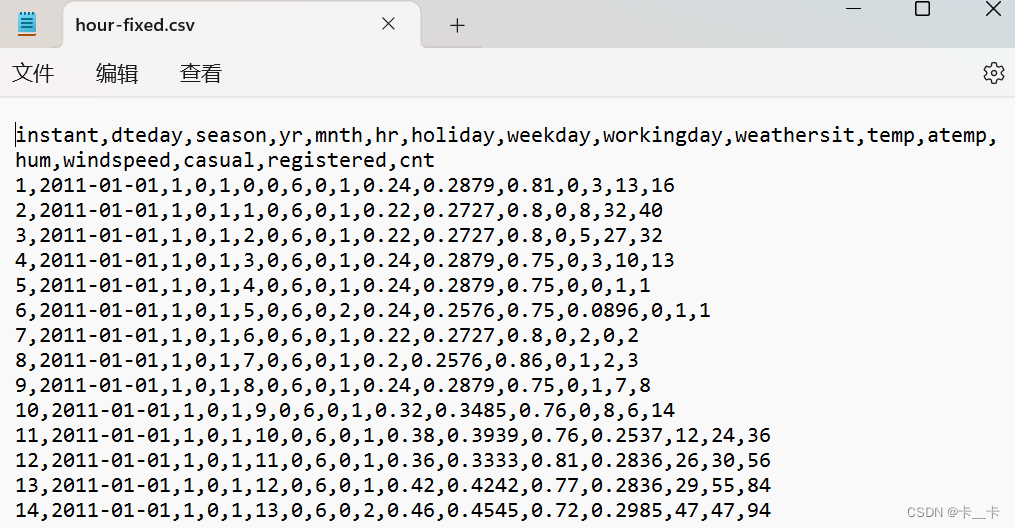
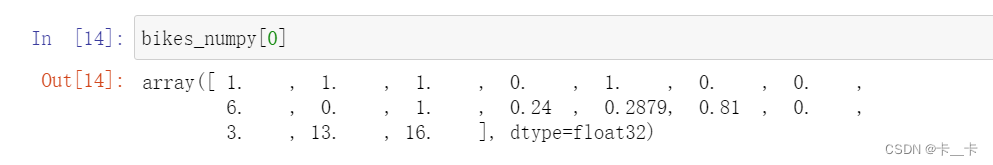
bikes_numpy=np.loadtxt("D:/bike-sharing-dataset/hour-fixed.csv",dtype=np.float32,delimiter=",",skiprows=1,converters={
1:lambda x:float(x[8:10])})
文件中的数据采用逗号分隔,跳过了第一行(标题行),并对第二列(第1个索引,由 0 开始)的数据进行了特殊的转换,使用了一个 lambda 函数,将字符串索引为 8 和 9的位置转换为浮点数。
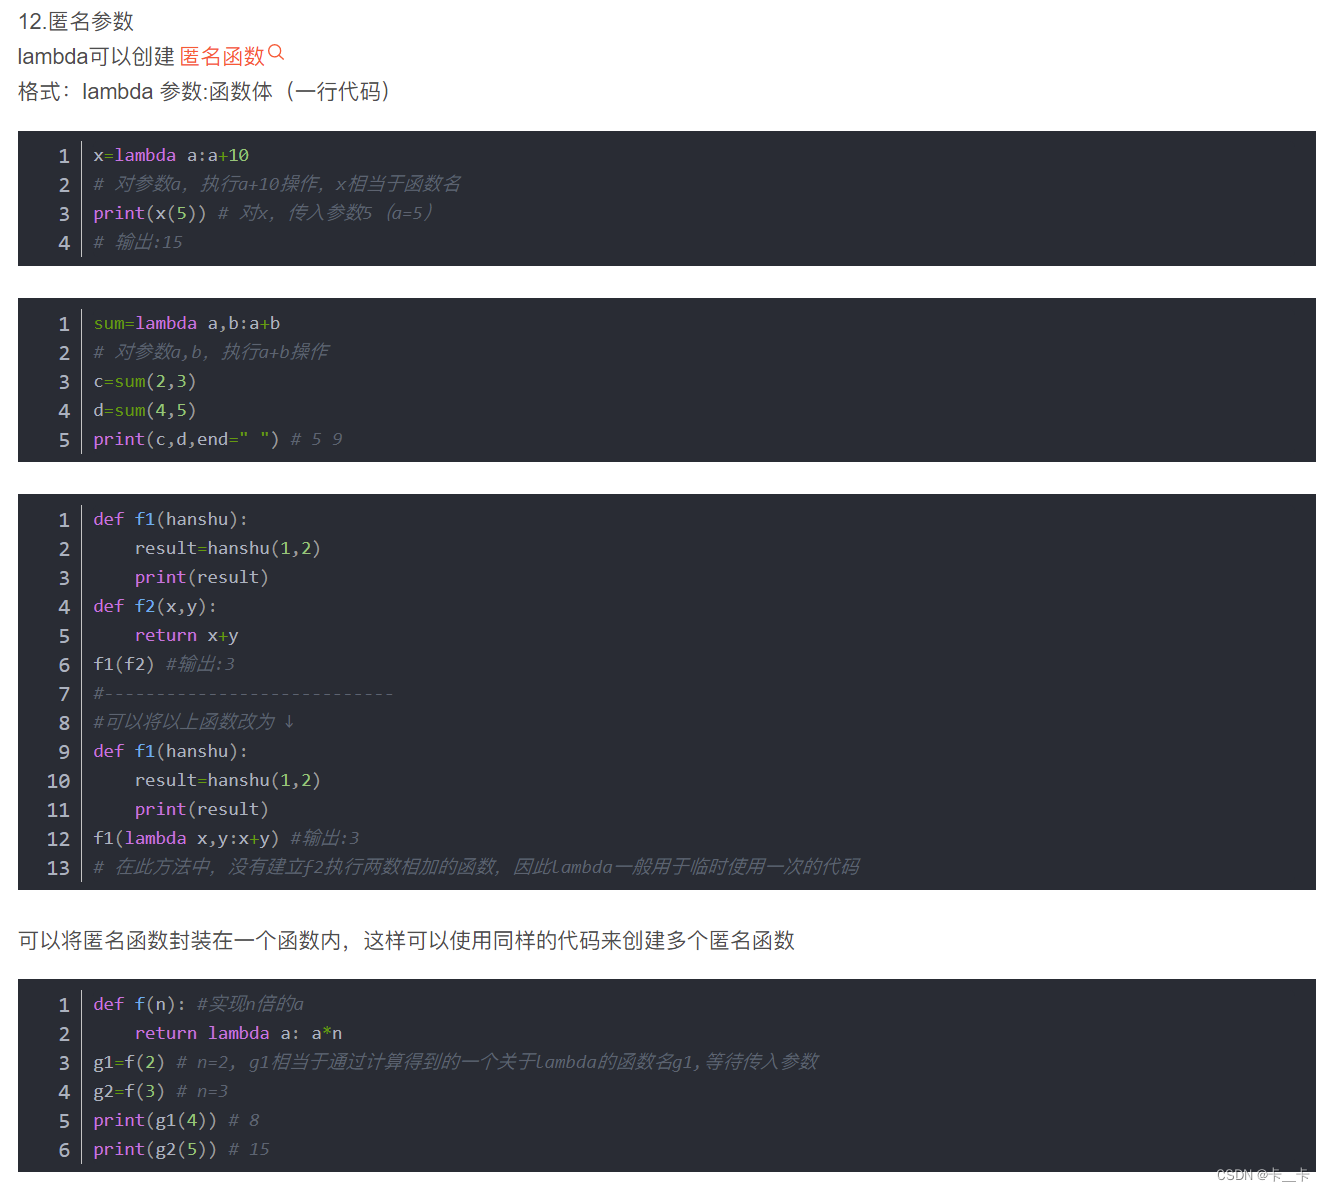
回顾:lambda 函数
每一个日期是10位数,格式为2011-01-01,索引从0起
因此将“日”位转化为了浮点数

每一行是一行数据
然后将其转化为tensor
import torch
bikes=torch.from_numpy(bikes_numpy)
bikes
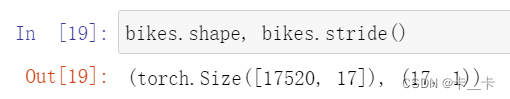
bikes.shape, bikes.stride()
关于表格中部分标题的说明
Season: season (1: spring, 2: summer, 3: fall, 4: winter)
Year: yr (0: 2011, 1: 2012)
Month: mnth (1 to 12)
Hour: hr (0 to 23)
Weather situation: weathersit (1: clear, 2:mist, 3: light rain/snow, 4: heavy rain/snow)
Temperature in °C: temp
Perceived temperature in °C: atemp
Humidity: hum
Wind speed: windspeed
Number of casual users: casual
Number of registered users: registered
Count of rental bikes: cnt
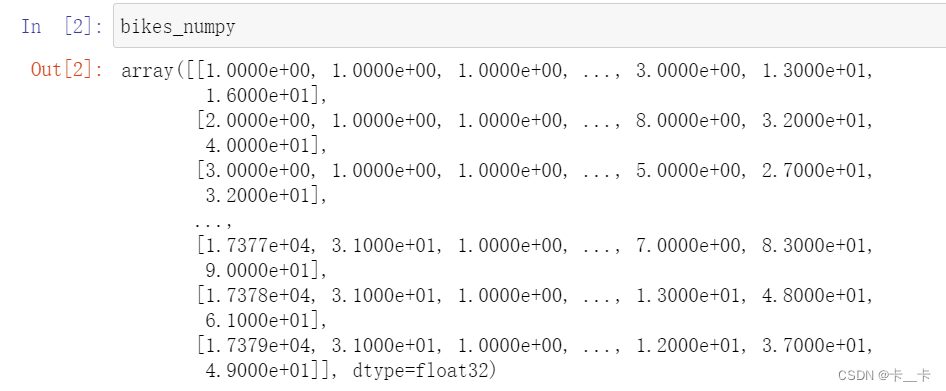
从表格可以看出,我们对每天的24小时进行了监测。一共有17,520小时,17列
Now let’s reshape the data to have 3 axes—day, hour, and then our 17 columns:
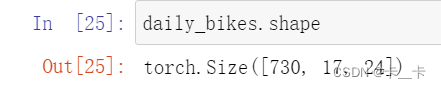
daily_bikes=bikes.view(-1,24,bikes.shape[1])
daily_bikes.shape
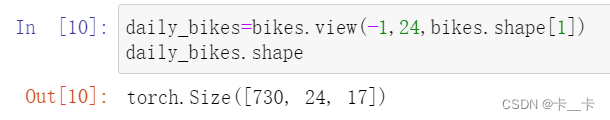
We use -1 as a placeholder for “however many indexes are left, given the other dimensions and the original number of elements.”
-1 表示根据其他维度的大小自动计算新的维度大小,以保持总元素数量不变。在这里,它会计算为 730,表示将原始 17520 个小时的数据合并为 730 组,每组包含 24 个小时的数据。(17520小时/每天24小时=730天)
daily_bikes.stride()
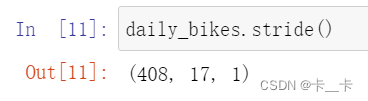
对于408:按天间隔,一行17个,一天24小时,17×24=408
As you learned in the previous chapter, calling view on a tensor returns a new tensor that changes the number of dimensions and the striding information, without changing the storage. This means we can rearrange our tensor at basically zero cost, because no data will be copied.
We see that the rightmost dimension is the number of columns in the original dataset. Then, in the middle dimension, we have time, split into chunks of 24 sequential hours. In other words, we now have N sequences of L hours in a day, for C channels.
我们得到N个长度为L的C序列集合。换句话说,我们的时间序列数据集将是一个维数为3的张量,形状为N×L×C。C将保持我们的17个通道,而L将是一天中的24小时,因此N表示天数730
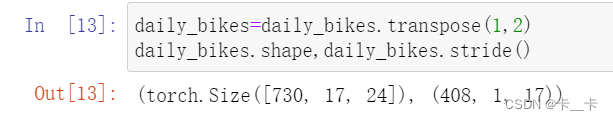
To get to our desired N × C × L ordering, we need to transpose the tensor:
daily_bikes=daily_bikes.transpose(1,2)
daily_bikes.shape,daily_bikes.stride()
Now let’s apply some of the techniques we learned earlier to this dataset.
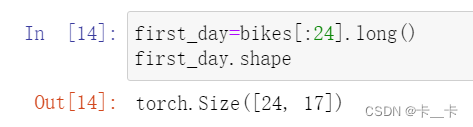
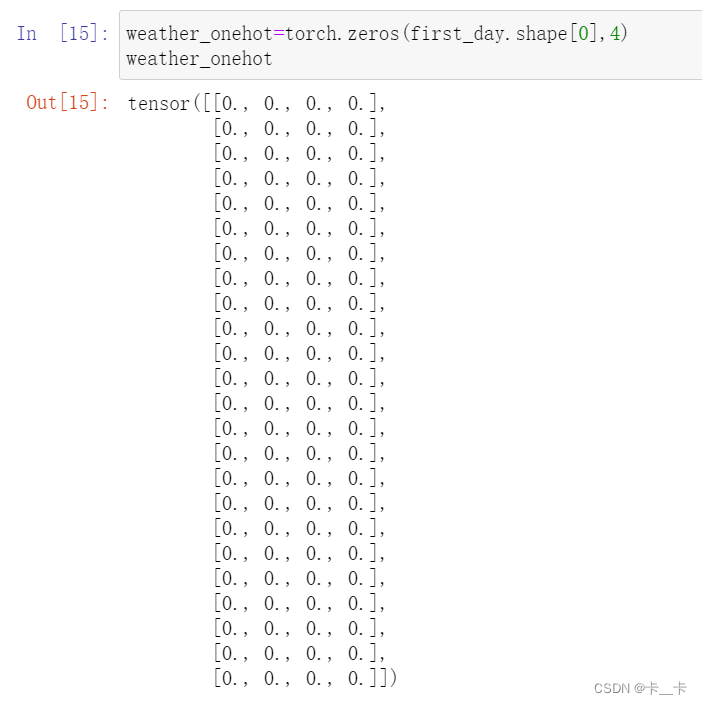
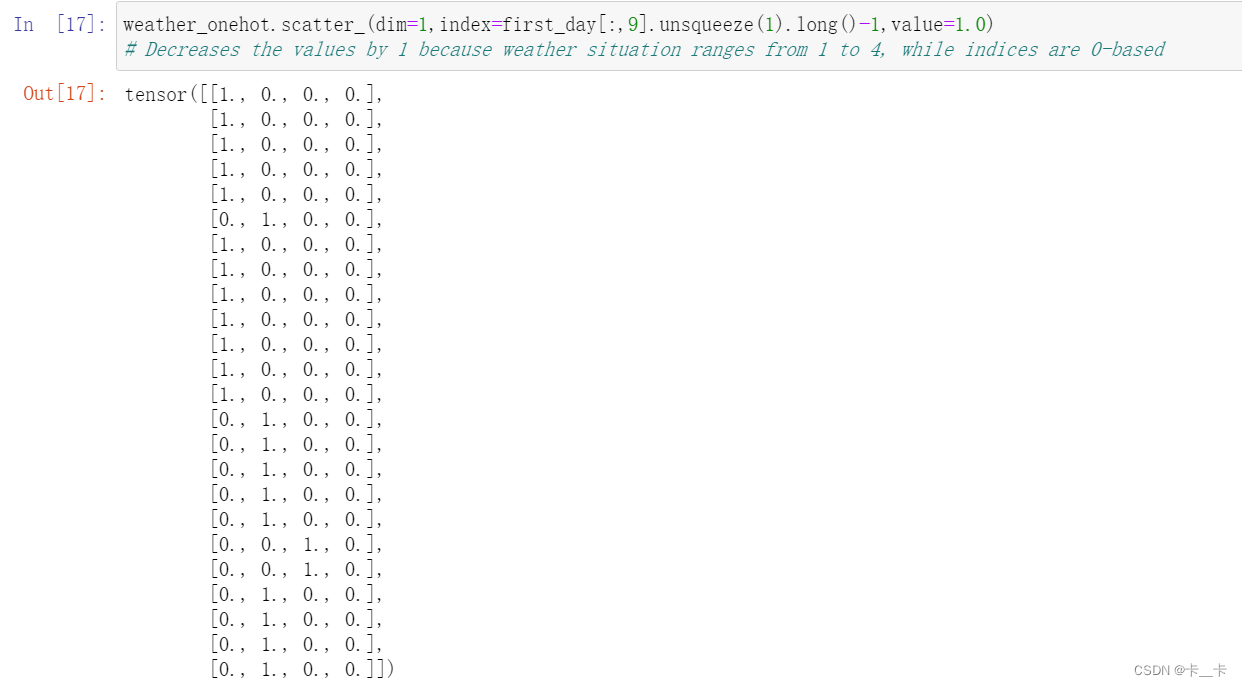
In order to make it easier to render our data, we’re going to limit ourselves to the first day for a moment. We initialize a zero-filled matrix with a number of rows equal to the number of hours in the day and number of columns equal to the number of weather levels:
first_day=bikes[:24].long()
first_day.shape
If we decided to go with categorical, we would turn the variable into a one-hot-encoded vector and concatenate the columns with the dataset.
我们关注weather situation列,取值为0~3,所以下面矩阵给4列
weather_onehot=torch.zeros(first_day.shape[0],4)
weather_onehot
first_day[:,9]

Then we scatter ones into our matrix according to the corresponding level at each row.
weather_onehot.scatter_(dim=1,index=first_day[:,9].unsqueeze(1).long()-1,value=1.0)
# Decreases the values by 1 because weather situation ranges from 1 to 4, while indices are 0-based
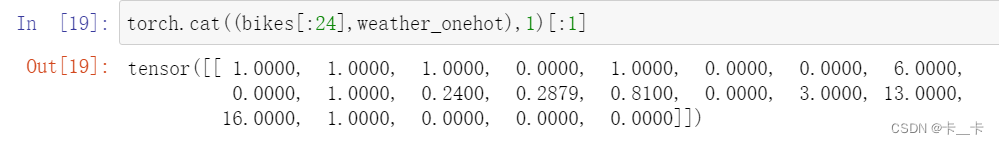
Last, we concatenate our matrix to our original dataset using the cat function.
Let’s look at the first of our results:
torch.cat((bikes[:24],weather_onehot),1)[:1]
bikes[:24]取第一天24小时的所有数据
torch.cat 函数将bikes[:24](24×17)和weather_onehot(24×4)在第1维度(列维度)进行连接
注:列维度拼接可以看做是“为增加列”而进行的拼接,是左右拼接的
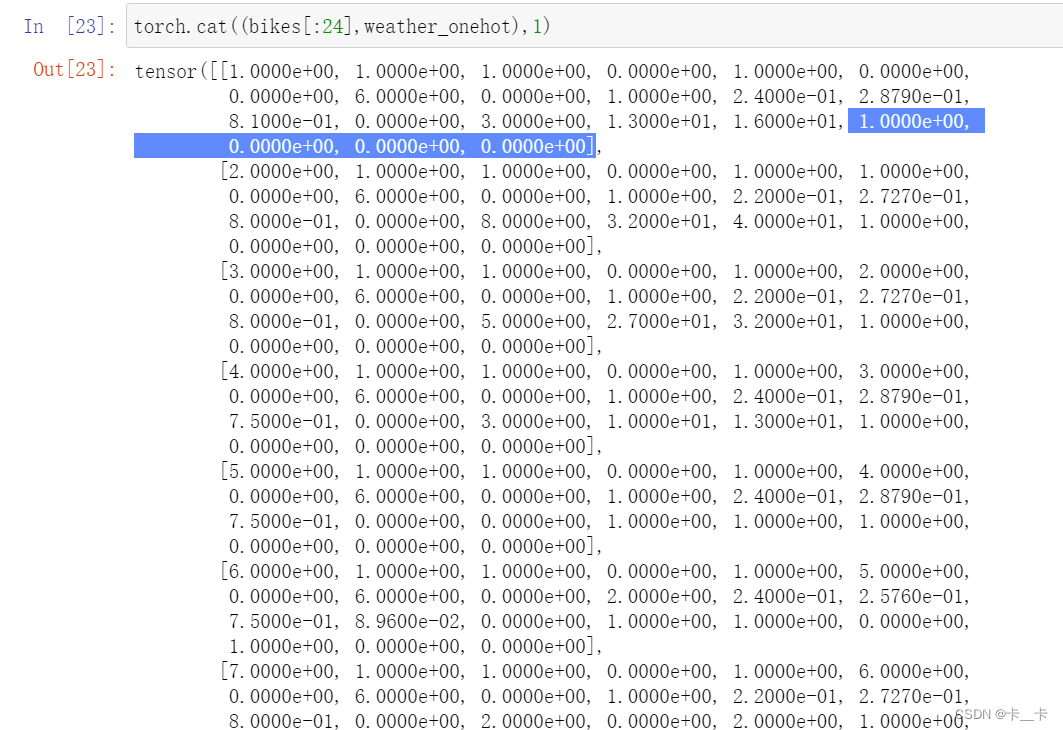
[:1] 是取连接后张量的第0行
We could have done the same with the reshaped daily_bikes tensor.
daily_bikes.shape
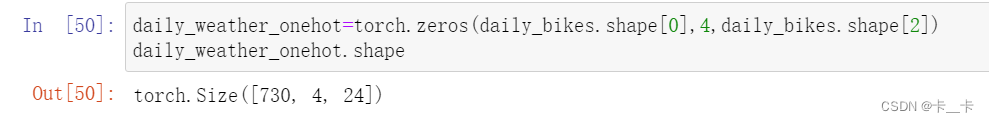
daily_weather_onehot=torch.zeros(daily_bikes.shape[0],4,daily_bikes.shape[2])
daily_weather_onehot[0]
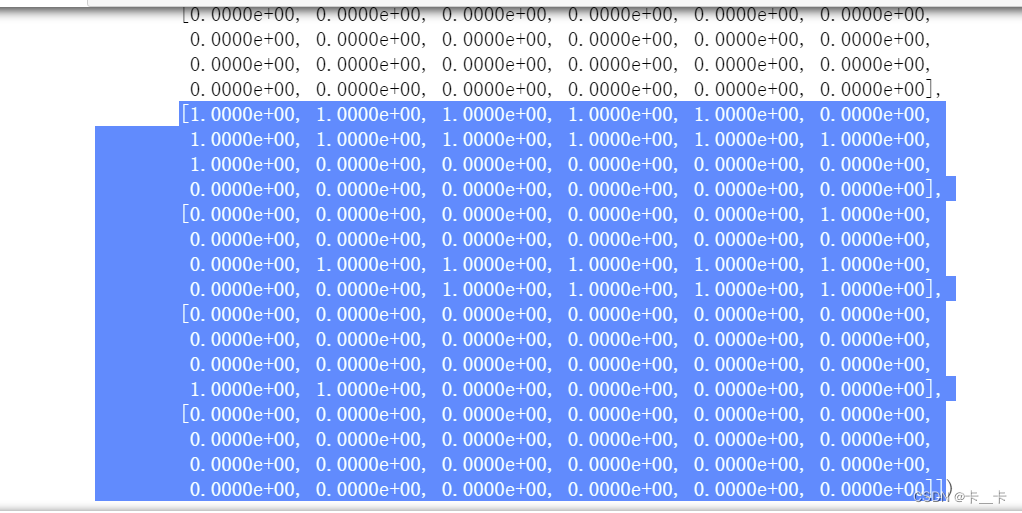
daily_weather_onehot.scatter_(1,daily_bikes[:,9,:].long().unsqueeze(1)-1,1.0)
daily_weather_onehot[0]
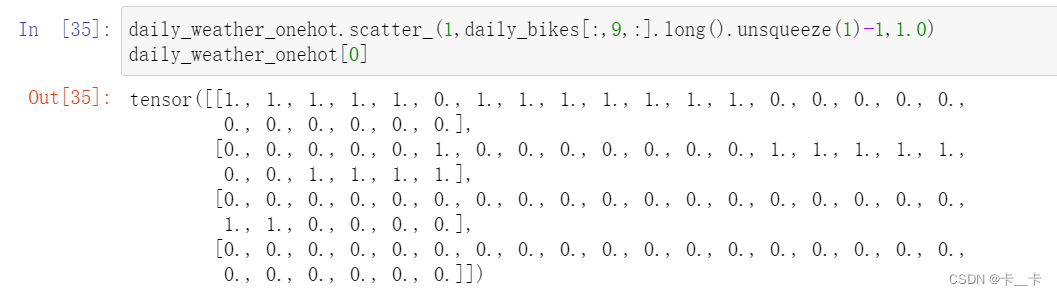
daily_weather_onehot[0]表示第一天24小时的数据,每行用1.0表示weathersit为该行的小时序号,如第一行表示weathersit为1的小时序号,第二行表示weathersit为2的小时序号
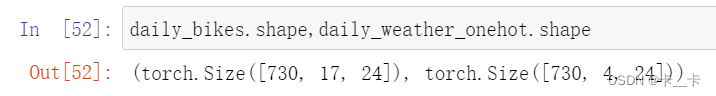
daily_bikes.shape,daily_weather_onehot.shape
daily_bikes=torch.cat((daily_bikes,daily_weather_onehot),dim=1)
daily_bikes[0]
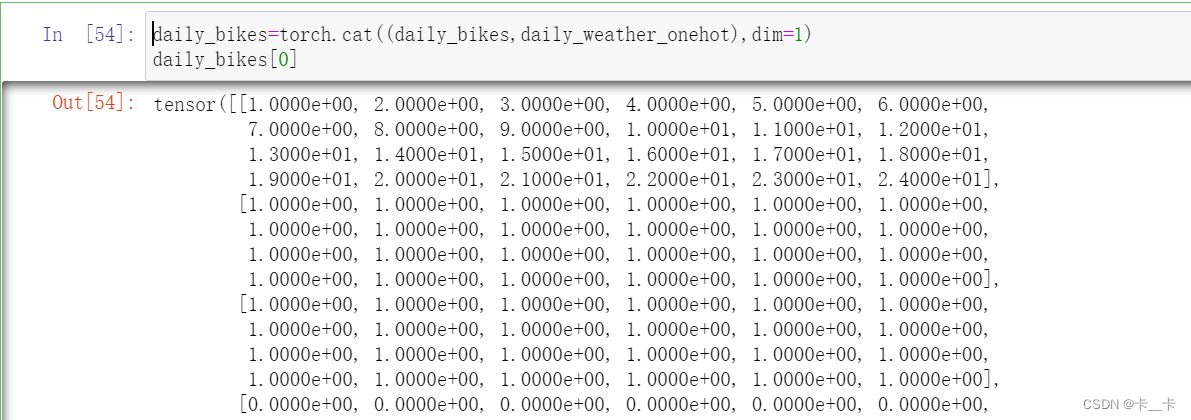
(续)完成行拼接
We mentioned earlier that this is not the only way to treat our “weather situation” variable. Indeed, its labels have an ordinal relationship, so we could pretend they are special values of a continuous variable. We could just transform the variable so that it runs from 0.0 to 1.0:(数据标准化)
方法一:减最小值/范围
范围指数据最大值和最小值的差
例如:上述weathersit的取值为1~3(可取值为1 ~ 4)
daily_bikes[:,9,:]=(daily_bikes[:,9,:]-1.0)/3
通过这种方式就可也将数据限制在0到1
应用到数据同样,例如我们用temp行(第10行)
temp=daily_bikes[:,10,:]
temp_min=torch.min(temp)
temp_max=torch.max(temp)
daily_bikes[:,10,:]=(daily_bikes[:,10,:]-temp_min)/(temp_max-temp_min)
方法二:减去平均值,除以标准差
temp=daily_bikes[:,10,:]
daily_bikes[:,10,:]=(daily_bikes[:,10,:]-torch.mean(temp))/torch.std(temp)
Rescaling variables to the [0.0, 1.0] interval or the [-1.0, 1.0] interval is something we’ll want to do for all quantitative variables, like temperature (column 10 in our dataset). We’ll see why later; for now, let’s just say that this is beneficial to the training process.
We’ve built another nice dataset, and we’ve seen how to deal with time series data.
总结:
本文主要介绍了如何处理时间序列数据。在前一节中,我们介绍了如何表示组织在平面表中的数据。每一行都是独立的,它们的顺序并不重要,或者等效地说,没有列编码信息表明哪些行先出现,哪些后出现。
接着,我们引入了一个新的数据集,即华盛顿特区的自行车共享系统数据集。该数据集报告了2011年至2012年期间首都自行车共享系统每小时的租赁自行车数量,以及天气和季节信息。我们将这个平面的2D数据集转换为一个3D的时间序列数据集。时间序列数据集是一个三维张量,其中一个维度表示天数,另一个维度表示一天中的小时,第三个维度表示数据的不同列(例如天气、温度等)。
为了实现这个目标,我们首先将原始数据集转换为一个3D张量,其中每个小时的数据被堆叠在一起。然后使用view函数将数据进一步重新形状为N×L×C的形式,其中N表示样本数量,C表示数据的列数,L表示每天的小时数。最后使用transpose函数将数据重新排列为N×C×L的形式。
接下来,我们处理时间序列中的天气信息,该信息是有序的离散值。将天气信息转化为one-hot encoding,并将其与原始数据集拼接在一起,以便神经网络能够处理它。
最后我们提到了两种数据标准化的方式,这将有助于我们训练数据。