import torch.nn.functional as F
import torch
import matplotlib.pyplot as plt
import numpy as np
import matplotlib
import random
pred = np.load('/home/fight/Desktop/LTSF-Linear-main/results/ETTm2_96_336_oneCNN_ETTm2_ftM_sl96_ll48_pl336_dm512_nh8_el2_dl1_df2048_fc1_ebtimeF_dtTrue_Exp_0/pred.npy')
true = np.load('/home/fight/Desktop/LTSF-Linear-main/results/ETTm2_96_336_oneCNN_ETTm2_ftM_sl96_ll48_pl336_dm512_nh8_el2_dl1_df2048_fc1_ebtimeF_dtTrue_Exp_0/true.npy')
input = np.load('/home/fight/Desktop/LTSF-Linear-main/results/ETTm2_96_336_oneCNN_ETTm2_ftM_sl96_ll48_pl336_dm512_nh8_el2_dl1_df2048_fc1_ebtimeF_dtTrue_Exp_0/x.npy')
print(pred.shape)
print(true.shape)
print(input.shape)
pred = torch.from_numpy(pred).permute(0,2,1)
true = torch.from_numpy(true).permute(0,2,1)
input = torch.from_numpy(input).permute(0,2,1)
pred = np.array(pred)
true = np.array(true)
input = np.array(input)
print(pred.shape)
print(true.shape)
print(input.shape)
#取 第i个batch 的最后OT列
i=0
pred_sample = pred[i][-1]
true_sample = true[i][-1]
input_sample = input[i][-1]
x_axis = list(range(336+96))
tx_true = np.concatenate((input_sample, true_sample))
tx_pred = np.concatenate((input_sample, pred_sample))
# x_axis = torch.from_numpy(x_axis)
print(pred_sample.shape)
print(true_sample.shape)
print(input_sample.shape)
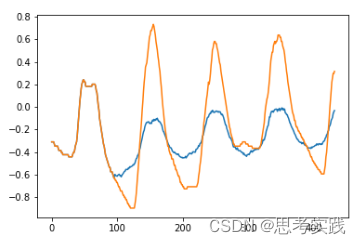
plt.plot(x_axis,tx_pred)
plt.plot(x_axis,tx_true)
plt.show()