线性支持向量机
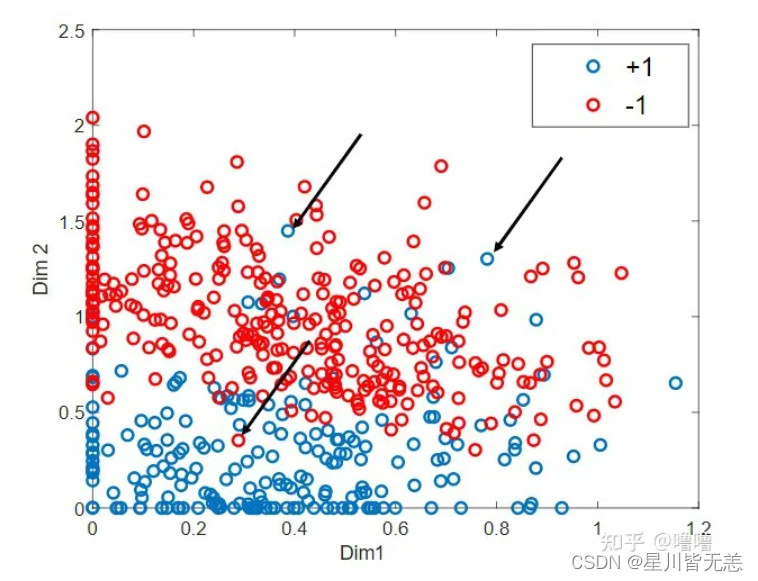
先来看一下什么叫数据近似线性可分,如下图所示,蓝色圆点和红色圆点分别代表正类和负类,显然我们不能找到一个线性的分离超平面将这两类完全正确的分开;但是如果将数据中的某些特异点(黑色箭头指向的点)去除之后,剩下的大部分样本点组成的集合是线性可分的,这样的数据就叫做近似线性可分。
通过SVM线性支持向量机分类鸢尾花数据集iris求出错误率并可视化
Iris 鸢尾花数据集是一个经典数据集,在统计学习和机器学习领域都经常被用作示例。数据集内包含 3 类共 150 条记录,每类各 50 个数据,每条记录都有 4 项特征:花萼长度、花萼宽度、花瓣长度、花瓣宽度,可以通过这4个特征预测鸢尾花卉属于(iris-setosa, iris-versicolour, iris-virginica)中的哪一品种。
目标:
1、通过知识向量机算法对iris数据集前两个维度的数据进行模型训练并求出错误率,最后进行可视化展示数据区域划分。
2、通过知识向量机算法对iris数据集总共四个维度的数据进行模型训练并求出错误率。
SVM的主要思想是:建立一个超平面作为决策平面,使得正例和反例之间的隔离边缘被最大化。SVM也是结构风险最小化方法的近似实现。

步骤:
1、先载入iris数据集 Load Iris data
2、分离训练集和设置测试集split train and test sets
3、对数据进行标准化处理Normalize the data
4、使用知识向量机模型进行训练Train using SVM
5、然后进行可视化处理Visualization
6、最后通过绘图决策平面plot decision plane
程序代码
1、通过知识向量机算法对iris数据集前两个维度的数据进行模型训练并求出错误率,最后进行可视化展示数据区域划分:
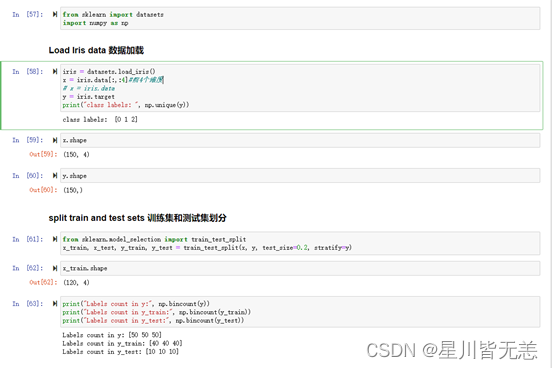
from sklearn import datasets
import numpy as np
### Load Iris data 数据加载
iris = datasets.load_iris()
x = iris.data[:,:2]#前2个维度
# x = iris.data
y = iris.target
print("class labels: ", np.unique(y))
x.shape
y.shape
### split train and test sets 训练集和测试集划分
from sklearn.model_selection import train_test_split
x_train, x_test, y_train, y_test = train_test_split(x, y, test_size=0.2, stratify=y)
x_train.shape
print("Labels count in y:", np.bincount(y))
print("Labels count in y_train:", np.bincount(y_train))
print("Labels count in y_test:", np.bincount(y_test))
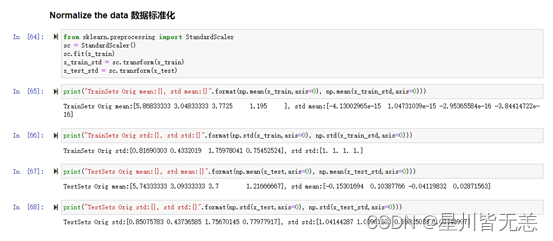
### Normalize the data 数据标准化处理
from sklearn.preprocessing import StandardScaler
sc = StandardScaler()
sc.fit(x_train)
x_train_std = sc.transform(x_train)
x_test_std = sc.transform(x_test)
print("TrainSets Orig mean:{}, std mean:{}".format(np.mean(x_train,axis=0), np.mean(x_train_std,axis=0)))
print("TrainSets Orig std:{}, std std:{}".format(np.std(x_train,axis=0), np.std(x_train_std,axis=0)))
print("TestSets Orig mean:{}, std mean:{}".format(np.mean(x_test,axis=0), np.mean(x_test_std,axis=0)))
print("TestSets Orig std:{}, std std:{}".format(np.std(x_test,axis=0), np.std(x_test_std,axis=0)))
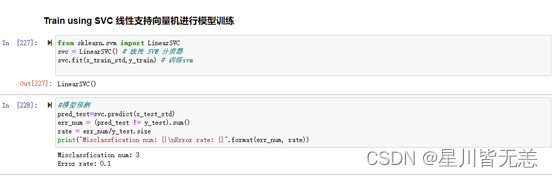
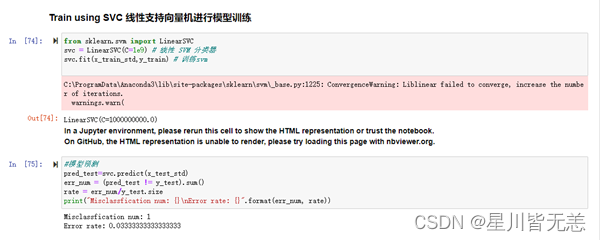
### Train using SVC 线性支持向量机进行模型训练
from sklearn.svm import LinearSVC
svc = LinearSVC(C=1e9) # 线性 SVM 分类器
svc.fit(x_train_std,y_train) # 训练svm
#模型预测并求出错误率
pred_test=svc.predict(x_test_std)
err_num = (pred_test != y_test).sum()
rate = err_num/y_test.size
print("Misclassfication num: {}\nError rate: {}".format(err_num, rate))
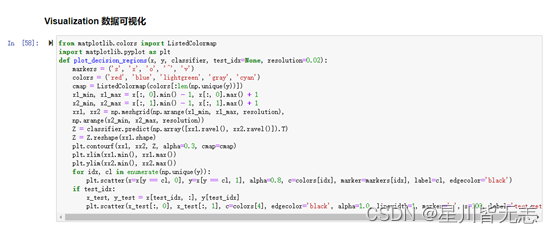
### Visualization 二维数据可视化
x_combined_std = np.vstack((x_train_std, x_test_std))
y_combined = np.hstack((y_train, y_test))
plot_decision_regions(x_combined_std, y_combined,
classifier=knn, test_idx=range(105,150))
plt.xlabel('petal length [standardized]')
plt.ylabel('petal width [standardized]')
plt.legend(loc='upper left')
plt.tight_layout()
plt.show()
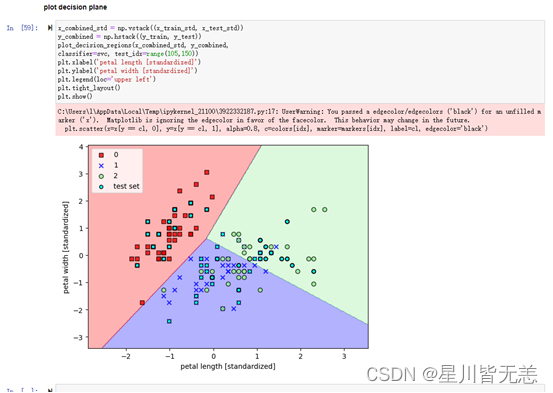
#### plot decision plane
x_combined_std = np.vstack((x_train_std, x_test_std))
y_combined = np.hstack((y_train, y_test))
plot_decision_regions(x_combined_std, y_combined,
classifier=svc, test_idx=range(105,150))
plt.xlabel('petal length [standardized]')
plt.ylabel('petal width [standardized]')
plt.legend(loc='upper left')
plt.tight_layout()
plt.show()
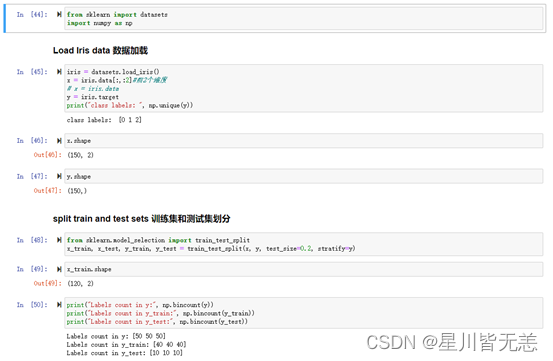
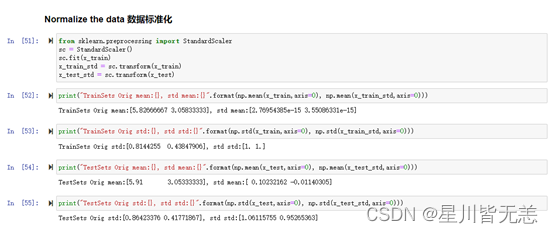
jupyter notebook截图:
2、通过线性知识向量机算法对iris数据集总共四个维度的数据进行模型训练并求出错误率:
from sklearn import datasets
import numpy as np
### Load Iris data 数据加载
iris = datasets.load_iris()
x = iris.data[:,:4]#4个维度数据
# x = iris.data
y = iris.target
print("class labels: ", np.unique(y))
x.shape
y.shape
### split train and test sets 训练集和测试集划分
from sklearn.model_selection import train_test_split
x_train, x_test, y_train, y_test = train_test_split(x, y, test_size=0.2, stratify=y)
x_train.shape
print("Labels count in y:", np.bincount(y))
print("Labels count in y_train:", np.bincount(y_train))
print("Labels count in y_test:", np.bincount(y_test))
### Normalize the data  数据标准化处理
#对于支持向量机而言,如果不使用归一化将特征无量纲化,特征分布就会呈椭圆状,在训练模型的时候不仅会影响模型预测精度,甚至会使模型训练跳入死循环,无法收敛。

from sklearn.preprocessing import StandardScaler
sc = StandardScaler()
sc.fit(x_train)
x_train_std = sc.transform(x_train)
x_test_std = sc.transform(x_test)
print("TrainSets Orig mean:{}, std mean:{}".format(np.mean(x_train,axis=0), np.mean(x_train_std,axis=0)))
print("TrainSets Orig std:{}, std std:{}".format(np.std(x_train,axis=0), np.std(x_train_std,axis=0)))
print("TestSets Orig mean:{}, std mean:{}".format(np.mean(x_test,axis=0), np.mean(x_test_std,axis=0)))
print("TestSets Orig std:{}, std std:{}".format(np.std(x_test,axis=0), np.std(x_test_std,axis=0)))
### Train using SVC  线性支持向量机进行模型训练
from sklearn.svm import LinearSVC
svc = LinearSVC() # 线性 SVM 分类器
svc.fit(x_train_std,y_train) # 训练svm

#模型预测并求出错误率
pred_test=svc.predict(x_test_std)
err_num = (pred_test != y_test).sum()
rate = err_num/y_test.size
print("Misclassfication num: {}\nError rate: {}".format(err_num, rate))
#四维数据

归一化和标准化的区别
归一化和标准化其实在某种程度上非常相似,归一化是将样本的特征值转换到同一量纲下把数据映射到[0,1]或者[-1, 1]区间内,仅由变量的极值决定,因区间放缩法是归一化的一种。标准化是依照特征矩阵的列处理数据,其通过求z-score的方法,转换为标准正态分布,和整体样本分布相关,每个样本点都能对标准化产生影响。它们的相同点在于都能取消由于量纲不同引起的误差;都是一种线性变换,都是对向量X按照比例压缩再进行平移。
对于支持向量机而言,如果不使用归一化将特征无量纲化,特征分布就会呈椭圆状,在训练模型的时候不仅会影响模型预测精度,甚至会使模型训练跳入死循环,无法收敛。不同的模型对特征的分布假设是不一样的。比如SVM 用高斯核的时候,所有维度共用一个方差,需要假设特征分布是圆,输入椭圆的特征就会使模型效果变差。
SVM思想是建立超平面作为决策平面,使正例和反例之间的隔离边缘最大化,也是结构风险最小化方法的近似实现。如果一个样例点靠近我们的超平面,我们将它对应的 增大,类似于惩罚,为了使松弛变量发挥作用,设置一个惩罚参数,作为上界, 如果大于这个参数则均取得这个参数,以便于让松弛项发挥作用。当松弛变量 =0,则说明不需要进行软约束既满足正确分类且满足硬间隔最大化,样例在间隔边界上;当松弛变量增大,说明该样例已经进入了两个间隔之间,松弛变量的数值越大,则说明我们需要对这个样采取更放松的条件,当放松的条件超过某个值,即 >1,说明该样例已经被目前的超平面错误分类。