import pandas as pd
import numpy as np
import matplotlib.pyplot as plt
%matplotlib inline

# 读取employee数据集
employee = pd.read_csv('data/employee.csv', parse_dates=['HIRE_DATE', 'JOB_DATE']) #parse_dates将哪一列解析为时间索引
employee.head()
| |
UNIQUE_ID |
POSITION_TITLE |
DEPARTMENT |
BASE_SALARY |
RACE |
EMPLOYMENT_TYPE |
GENDER |
EMPLOYMENT_STATUS |
HIRE_DATE |
JOB_DATE |
| 0 |
0 |
ASSISTANT DIRECTOR (EX LVL) |
Municipal Courts Department |
121862.0 |
Hispanic/Latino |
Full Time |
Female |
Active |
2006-06-12 |
2012-10-13 |
| 1 |
1 |
LIBRARY ASSISTANT |
Library |
26125.0 |
Hispanic/Latino |
Full Time |
Female |
Active |
2000-07-19 |
2010-09-18 |
| 2 |
2 |
POLICE OFFICER |
Houston Police Department-HPD |
45279.0 |
White |
Full Time |
Male |
Active |
2015-02-03 |
2015-02-03 |
| 3 |
3 |
ENGINEER/OPERATOR |
Houston Fire Department (HFD) |
63166.0 |
White |
Full Time |
Male |
Active |
1982-02-08 |
1991-05-25 |
| 4 |
4 |
ELECTRICIAN |
General Services Department |
56347.0 |
White |
Full Time |
Male |
Active |
1989-06-19 |
1994-10-22 |
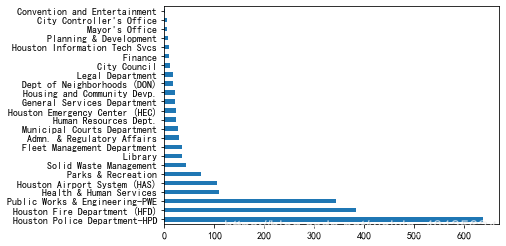
用seaborn画出每个部门的柱状图
# 用seaborn画出每个部门的柱状图
import pandas as pd
import seaborn as sns
sns.countplot(y='DEPARTMENT', data=employee)

要是用pandas来做,需要先聚合数据
# 要是用pandas来做,需要先聚合数据
employee['DEPARTMENT'].value_counts().plot(kind='barh')
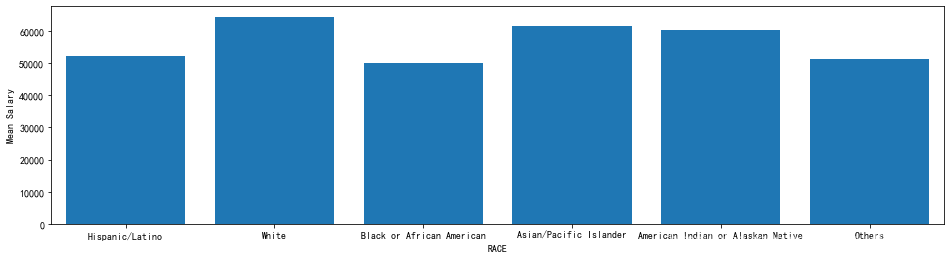
用seaborn找到每个种族的平均工资
# 用seaborn找到每个种族的平均工资
ax = sns.barplot(x='RACE', y='BASE_SALARY', data=employee) # barplot条形图
ax.figure.set_size_inches(16, 4) #set_size_inches,matplotlib 包中提供的函数,用于设置图形的尺寸

用pandas来做,需要先按照race分组
# 用pandas来做,需要先按照race分组
avg_sal = employee.groupby('RACE', sort=False)['BASE_SALARY'].mean()
ax = avg_sal.plot(kind='bar', rot=0, figsize=(16,4), width=.8)
ax.set_xlim(-.5, 5.5) #set_xlim(初始值,末值)
ax.set_ylabel('Mean Salary')
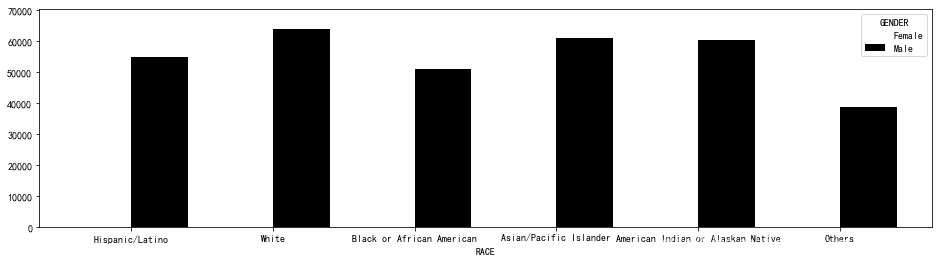
seaborn还支持在分组内使用第三个参数
# seaborn还支持在分组内使用第三个参数
ax = sns.barplot(x='RACE', y='BASE_SALARY', hue='GENDER', # hue  目标值是什么target
                          data=employee, palette='Greys')
ax.figure.set_size_inches(16,4) #set_size_inches,matplotlib 包中提供的函数,用于设置图形的尺寸
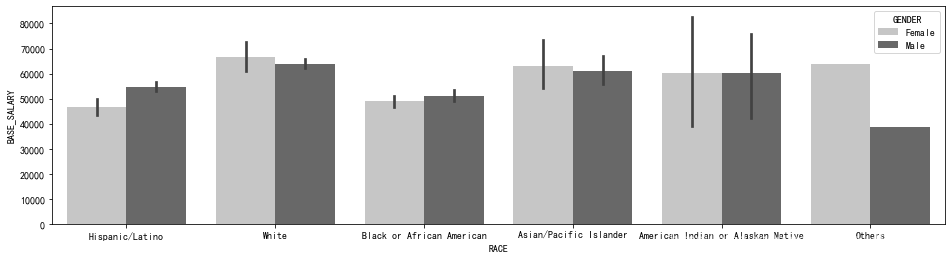
pandas则要对race和gender同时分组,并对gender做unstack
# pandas则要对race和gender同时分组,并对gender做unstack
employee.groupby(['RACE', 'GENDER'], sort=False)['BASE_SALARY'] \
                 .mean().unstack('GENDER') \
                 .plot(kind='bar', figsize=(16,4), rot=0,
                       width=.8, cmap='Greys')