pandas中的绘图函数(柱状图)
Series柱形图示例
kind = ‘bar’/‘barh’
s = Series(data=np.random.randint(60,98, size=5),index=list("ABCDE"))
s.plot(kind='bar')

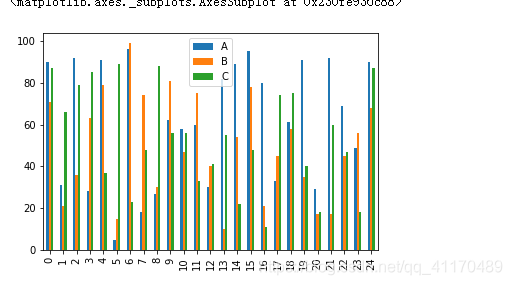
DataFrame柱状图示例
df = DataFrame(data=np.random.randint(0,100,size=(25,3)), columns=list("ABC"))
df.plot(kind='bar')
以y轴方向画图
# 画板
figure = plt.figure(figsize=(5,20))
# 画布
ax = plt.subplot(111)

df.plot(kind='barh', ax=ax)
例子:
tips.groupby("sex")["total_bill"].mean().plot(kind='bar')

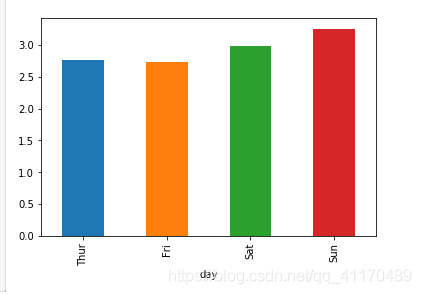
tips.groupby("day")["tip"].mean().plot(kind='bar')
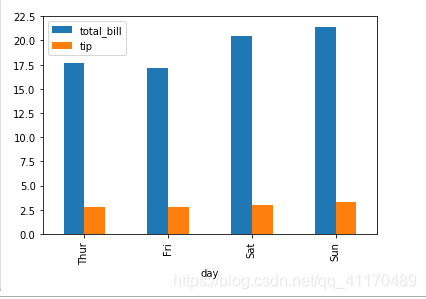
# 根据工作日,查看不同工作日下消费和账单平均的分布
tips.groupby("day").agg({"total_bill":"mean","tip":"mean"}).plot(kind='bar')