数据初探
原始数据下载地址为:传送门
网站对数据的描述如下:
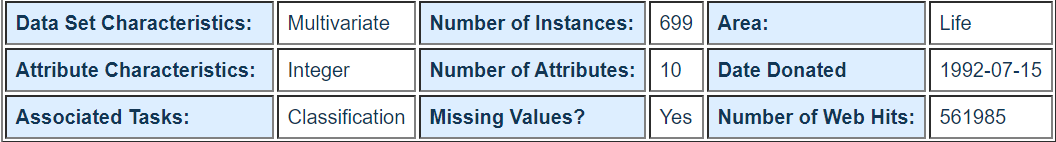

可得知该原始数据共有699条样本,每条样本有11列不同的数值: 1列用于检索的id,9列与肿瘤相关的医学特征,以及最后一列表征肿瘤类型的数值。所有9列用于表示肿瘤医学特质的数值均被量化为1~10之间的数字,而肿瘤的类型也借由数字2和数字4分别指代良性与恶性。这份数据也声明其中包含缺失值,事实上,缺失值问题广泛存在于现实数据中,也是机器学习任务无法回避的问题。
数据预处理
下面这段代码用于预处理原始肿瘤数据:
#导入pandas与numpy工具包。
import pandas as pd
import numpy as np
#创建特征列表。
column_names = ['Sample code number', 'Clump Thickness',
                'Uniformity of Cell Size', 'Uniformity of Cell Shape',
                'Marginal Adhesion','Single Epithelial CellSize',
                'Bare Nuclei', 'Bland Chromatin', 'Normal Nucleoli',
                'Mitoses', 'Class']
#使用pandas.readcsv函数从互联网读取指定数据。
data = pd.read_csv('breast-cancer-wisconsin.data', names=column_names)
#将?替换为标准缺失值表示。
data = data.replace (to_replace='?',value= np.nan)
#丢弃带有缺失值的数据(只要有一个维度有缺失)。
data = data.dropna(how='any')
#输出data的数据量和维度。
data.shape
(683, 11)
经过数据处理后,无缺失值的样本数一共683条,特征包括细胞厚度,细胞大小,形状等9个维度,并且每个维度的特征均量化为1~10之间的数值进行表示。
print(data.head())
   Sample code number  Clump Thickness  Uniformity of Cell Size  \
0             1000025                5                        1
1             1002945                5                        4
2             1015425                3                        1
3             1016277                6                        8
4             1017023                4                        1

   Uniformity of Cell Shape  Marginal Adhesion  Single Epithelial CellSize  \
0                         1                  1                           2
1                         4                  5                           7
2                         1                  1                           2
3                         8                  1                           3
4                         1                  3                           2

  Bare Nuclei  Bland Chromatin  Normal Nucleoli  Mitoses  Class
0           1                3                1        1      2
1          10                3                2        1      2
2           2                3                1        1      2
3           4                3                7        1      2
4           1                3                1        1      2
由于原始数据没有提供对应的测试样本用于评估模型性能,因此需要对带有标记的
数据进行分割。用15%的数据会作为测试集,其余75%的数据用于训练。
#使用sklearn.cross_valiation里的train_test_ split模块用于分割数据。
from sklearn.cross_validation import train_test_split
#随机采样25%的数据用于测试,剩下的75%用于构建训练集合。
x_train, x_test, y_train,y_test = train_test_split (data [column_names[1:10]],
                                                    data [column_names[10]],
                                                    test_size=0.25, random_state= 33)
#查验训练样本的数量和类别分布。
y_train.value_counts()
2    344
4    168
Name: Class, dtype: int64
#查验测试样本的数量和类别分布。
y_test.value_counts()
2    100
4     71
Name: Class, dtype: int64
综上,我们用于训练样本共有512条(344条良性肿瘤数据、168条恶性肿瘤数据),测
试样本有171条(100条良性肿瘤数据、71条恶性肿瘤数据)。
模型构建
接下来使用Logistic回归与随机梯度参数估计两种
方法对上述处理后的训练数据进行学习,并且根据测试样本特征进行预测。
 #从sklearn.preprocessing里导人StandardScaler.
from sklearn. preprocessing import StandardScaler
#从sklearn.linear_model里导人LogisticRegression与SGDClassifier.
from sklearn. linear_model import LogisticRegression
from sklearn.linear_model import SGDClassifier
#标准化数据,保证每个维度的特征数据方差为1,均值为0。使得预测结果不会被某些维过大的特征值而主导。
ss = StandardScaler ()
x_train = ss.fit_transform(x_train)
x_test = ss.transform(x_test)
#初始化LogisticRegression与SGDClassifier.
lr = LogisticRegression ()
sgdc = SGDClassifier ()
#调用LogisticRegression中的fit函数用来训练模型参数。
lr.fit(x_train, y_train)
#使用训练好的模型lr对x_test进行预测,结果储存在变量lr_ y predict中。
lr_y_predict = lr.predict(x_test)
#调用SGDClassifier中的fit函数用来训练模型参数。
sgdc.fit (x_train, y_train)
#使用训练好的模型sgdc对x_test进行预测,结果储存在变量sgdc_y_predict中。
sgdc_y_predict = sgdc.predict(x_test)
C:\ProgramData\Anaconda3\lib\site-packages\sklearn\linear_model\stochastic_gradient.py:128: FutureWarning: max_iter and tol parameters have been added in <class 'sklearn.linear_model.stochastic_gradient.SGDClassifier'> in 0.19. If both are left unset, they default to max_iter=5 and tol=None. If tol is not None, max_iter defaults to max_iter=1000. From 0.21, default max_iter will be 1000, and default tol will be 1e-3.
  "and default tol will be 1e-3." % type(self), FutureWarning)
预测结果展示
分别利用LogisticRegression与SGDClassifier针对171条测试样本进行预测工作。由于这171条测试样本拥有正确标记,并记录在变量y_test中,因此非常直观的做法是比对预测结果和原本正确标记,计算171条测试样本中,预测正确的百分比即正确率。
#从sklearn .metrics里导人classification report模块。
from sklearn.metrics import classification_report
#使用Logistic回归模型自带的评分函数score获得模型在测试集上的准确性结果。
print('Accuracy of LR Classifier:', lr.score(x_test, y_test))
#利用classification report 模块获得LogisticRegression其他三个指标的结果。
print(classification_report(y_test, lr_y_predict, target_names = ['Benign','Malignant']))
Accuracy of LR Classifier: 0.9883040935672515
             precision    recall  f1-score   support

     Benign       0.99      0.99      0.99       100
  Malignant       0.99      0.99      0.99        71

avg / total       0.99      0.99      0.99       171
#使用随机梯度下降模型自带的评分函数score获得模型在测试集上的准确性结果。
print ('Accuarcy of SGD Classifier:', sgdc.score(x_test, y_test))
 #利用classification report模块获得SGDClassifier其他三个指标的结果。
print (classification_report(y_test, sgdc_y_predict, target_names= [' Benign','Malignant']))
Accuarcy of SGD Classifier: 0.9824561403508771
             precision    recall  f1-score   support

     Benign       0.98      0.99      0.99       100
  Malignant       0.99      0.97      0.98        71

avg / total       0.98      0.98      0.98       171
结论
阅读了代码16输出的报告之后,我们可以发现: LogisticRegression比起SGDClassifier在测试集上表现有更高的准确性。这是因为Seikit-learn中采用解析的方式精确计算LogisticRegression的参数,而使用梯度法估计SGDClassifier的参数。
