已知在两次到达间隔直接服从指数分布,请证明在某段固定时间内的到达次数服从Poisson 分布 。
import scipy.stats as st
import numpy as np
import matplotlib.pyplot as plt
import statsmodels.api as sm
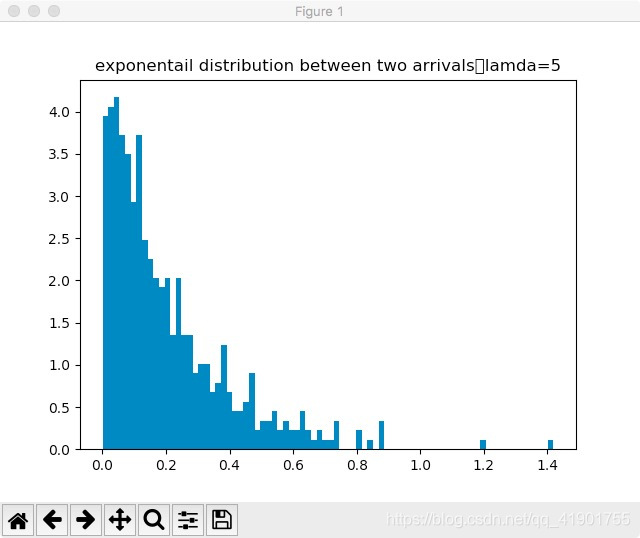
plt.figure() #exponentail distribution between two arrivals
sample =np.random.exponential(1/5,500)
plt.hist(sample, bins=80, normed=True)
plt.title('exponentail distribution between two arrivals,lamda=5 ZMF_ORIGINAL')
plt.show()
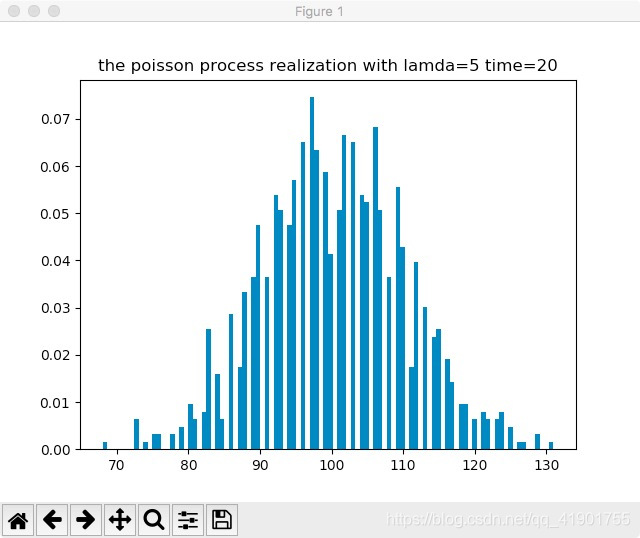
plt.figure() # generating poisson process according to random exponential distribution
T=20 # the length of t
arrival_times=np.zeros(1000)
for i in range(0,1000): # find sample set of 1000 arrival times in T.
interval_time_sum=np.zeros(501)
for j in range(0,500): # stimulate 500 times arriving
interval_time_sum[j+1]= np.random.exponential(1/5) +interval_time_sum[j] # lamda = 5
if interval_time_sum[j+1]>T :
arrival_times[i]=j
break
plt.hist(arrival_times, bins=100, normed=True)
plt.title('the poisson process realization with lamda=5 time=20,ZMF_ORIGINAL')
plt.show()
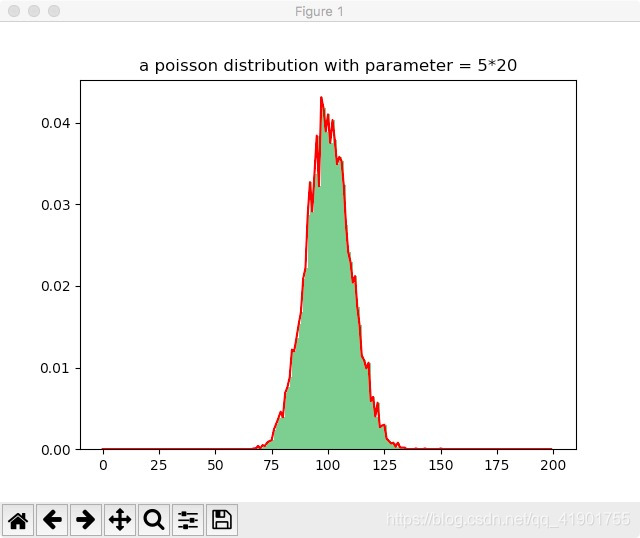
plt.figure() # a poisson distribution with parameter = 5*20
x = np.random.poisson(lam=5*20, size=1000)
pillar = 200
a = plt.hist(x, bins=pillar, normed=True, range=[0, pillar], color='g', alpha=0.5)
plt.plot(a[1][0:pillar], a[0], 'r')
plt.title('a poisson distribution with parameter = 5*20,ZMF_ORIGINAL')
plt.show()
程序解释:
firstly , i upload my programming for your preference, if you find any problems, please let me know and i will appreciate you very much .
my programming code consists of three parts to stimulate the poisson process .
in the first part, i generate the exponential distribution with parameter 5, which represent the probability of interval time between two arrivals .
in the second part, i statistic the probability distribution of arrival times in [0,T] (here, i define T=20) , i am surprised to find that it is really similar to poisson distribution ,which verified our learned knowledge in class !!!
and its mean arrival times is 100, which is actually lamda*T
in the third part, i generate a possion distribution with parameter 5*20 (the same parameter with the second part) to compare them .
运行结果: