参考matplotlib官方指南:
https://matplotlib.org/tutorials/introductory/usage.html#sphx-glr-tutorials-introductory-usage-py
matplotlib的用户指南分为三个等级:入门,中级,高级。在入门级,主要介绍下图内容

这里我首先介绍 使用指南 部分,即 Usage Guide。
1.一张图的组成
在使用matplotlib画图时,你会发现各种参数,下面就说说这些参数具体设置什么

2.画图函数的输入数据类型
最好将输入数据转换为np.array类型
如,将pandas.DataFrame转换为 np.array
1 a = pandas.DataFrame(np.random.rand(4,5), columns = list('abcde'))
2 a_asndarray = a.values
将 np.matrix 转换为 np.array
1 b = np.matrix([[1,2],[3,4]])
2 b_asarray = np.asarray(b)
3.matplotlib,pyplot 与 pylab的关系
pyplot是matplotlib的一个模块,pylab是与matplotlib共同安装的模块
4.自定义画图函数
如果现有的画图形状不满足需求,可以方便地定义画图函数
1 def my_plotter(ax, data1, data2, param_dict):
2 """
3 A helper function to make a graph
4
5 Parameters
6 ----------
7 ax : Axes
8 The axes to draw to
9
10 data1 : array
11 The x data
12
13 data2 : array
14 The y data
15
16 param_dict : dict
17 Dictionary of kwargs to pass to ax.plot
18
19 Returns
20 -------
21 out : list
22 list of artists added
23 """
24 out = ax.plot(data1, data2, **param_dict)
25 return out
26
27 # which you would then use as:
28
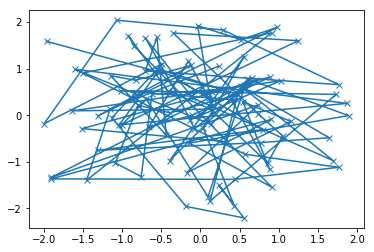
29 data1, data2, data3, data4 = np.random.randn(4, 100)
30 fig, ax = plt.subplots(1, 1)
31 my_plotter(ax, data1, data2, {'marker': 'x'})
5.交互模式
可以通过matplotlib.interactive(),matplotlib.is_interactive(),matplotlib.pyplot.ion()可以打开交互模式
使用 matplotlib.is_interactive()可以关闭交互模式
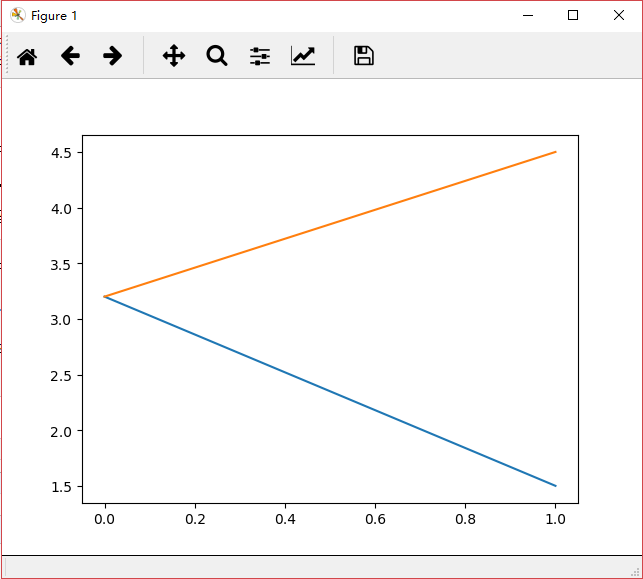
在ipython中运行以下代码:
1 import matplotlib.pyplot as plt
2 plt.ion()
3 plt.plot([1.6, 2.7])
4 ax = plt.gca()
5 ax.plot([3.1, 2.2])
6 plt.draw()