文章目录
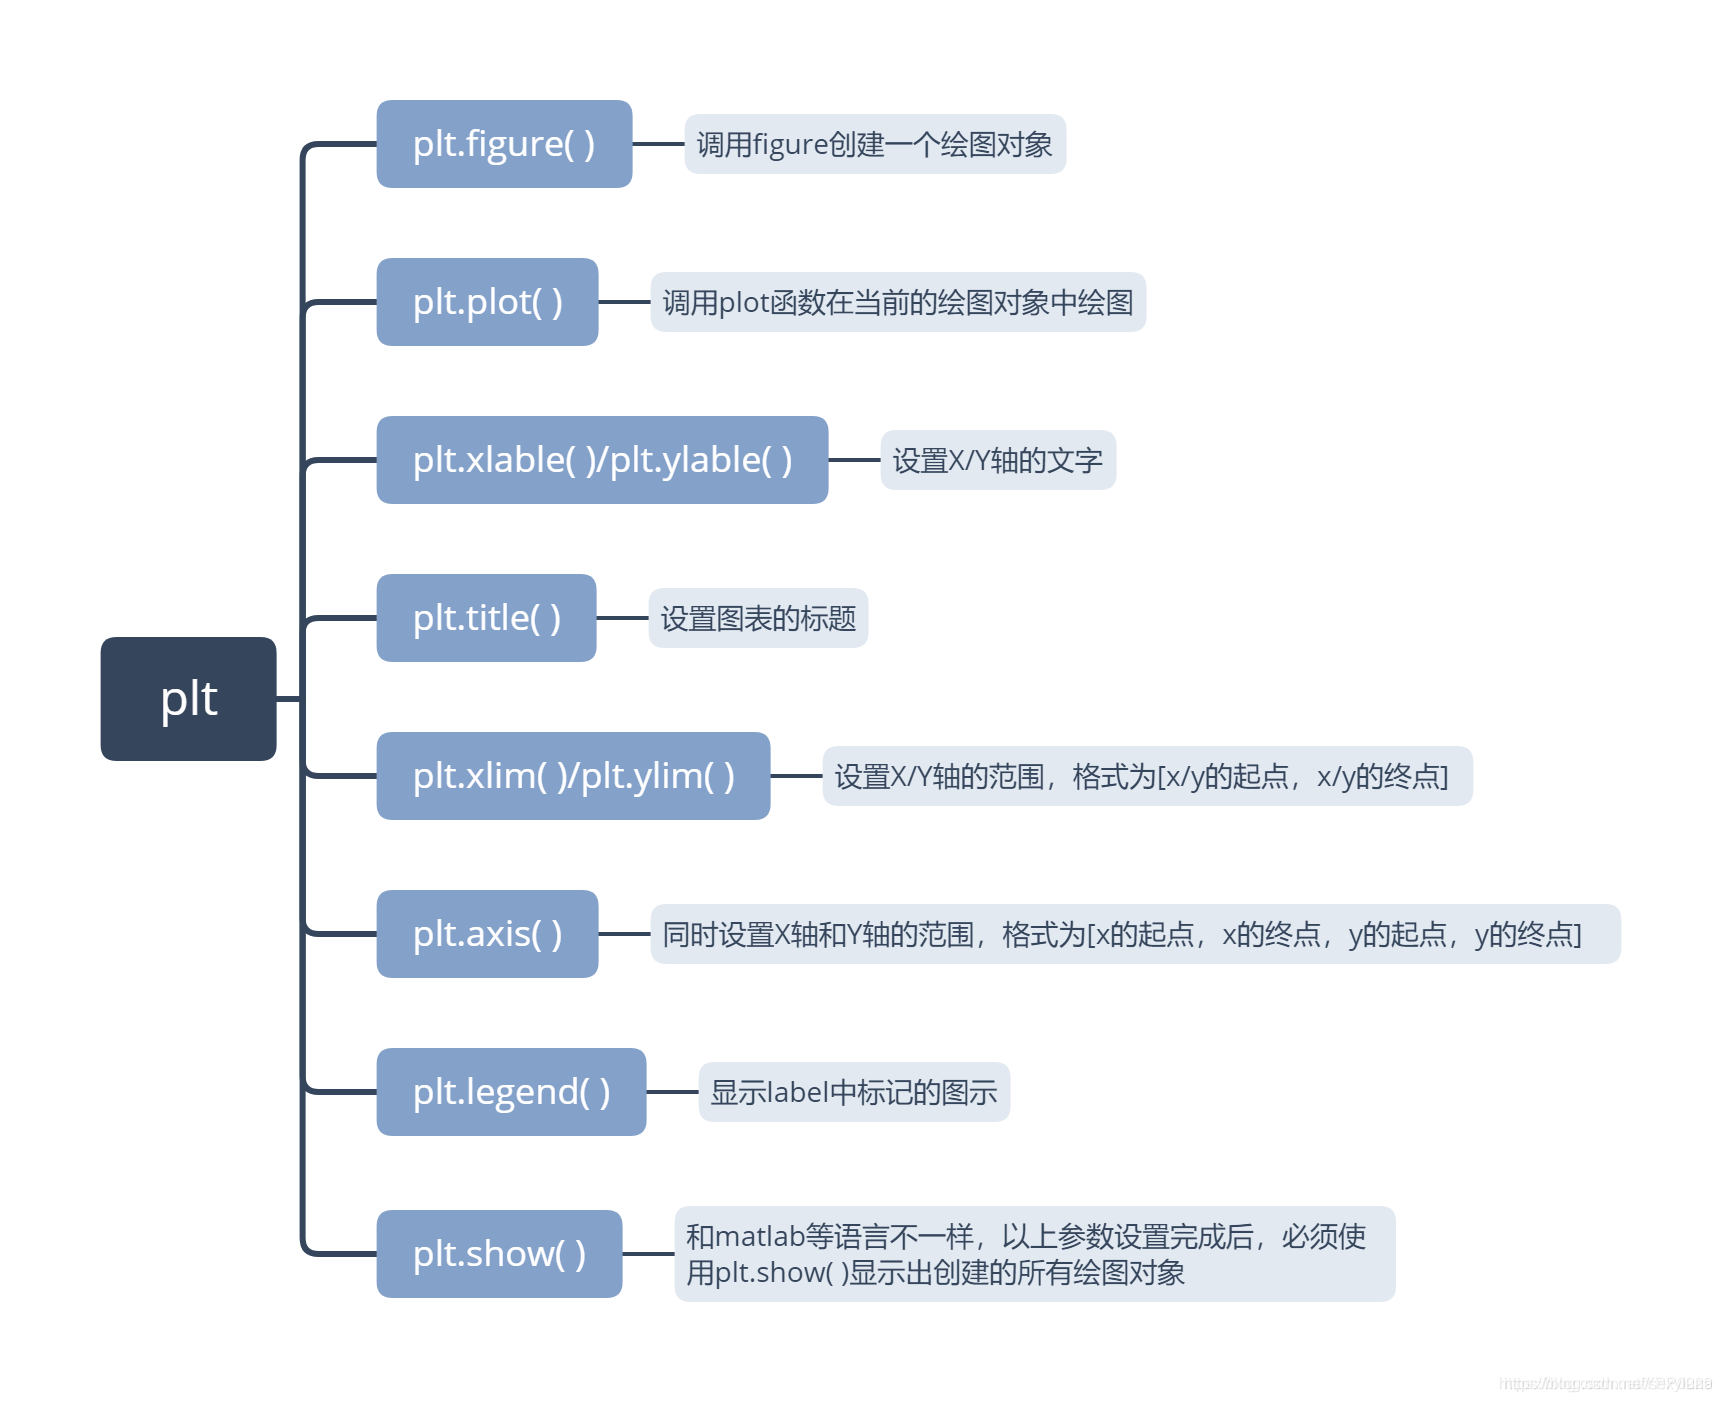
常见用法
代码演示
# from matplotlib import pyplot as plt
import matplotlib.pyplot as plt
from random import choice
# 类的简单使用
class dog():
def __init__(self, name, age):
self.name = name
self.age = age
def sit(self):
print(self.name.title() + " is now sitting.")
def roll_over(self):
print(self.name.title() + " rolled over!")
# matplotlib的简单使用
class matPlot():
def __init__(self):
print("简单的绘图练习")
# 简易的使用
def test_1(self):
y = [1, 2, 5, 8, 9]
plt.plot(y)
plt.show()
# 设置x , y , title
def test_2(self):
y = [1, 2, 5, 8, 9]
plt.plot(y, linewidth=5)
# 标题
plt.title("title", fontsize=20)
# x轴
plt.xlabel("x", fontsize=15)
# y轴
plt.ylabel("y", fontsize=15)
# 刻度尺样式,字体大小为15
plt.tick_params(axis='both', labelsize=15)
plt.show()
# 同时设置x和y对应关系
def test_3(self):
x = [1,2,3,4,5]
y = [2,4,6,8,0]
plt.plot(x,y)
plt.show()
# 散点图
def test_4(self):
x = [1,2,3,4,5]
y = [2,4,6,8,0]
plt.scatter(x,y)
plt.show()
# 自动计算
def test_5(self):
x_value = list(range(1, 1001))
y_value = [x**2 for x in x_value]
plt.scatter(x_value,y_value)
# 设置x,y轴的刻度,x[0,1001] y[1,100001]
plt.axis([0,1001,1,100001])
plt.show()
# 设置x,y轴的刻度
def test_6(self):
x_value = list(range(1, 1001))
y_value = [x**2 for x in x_value]
# 删除数据的轮廓
plt.scatter(x_value,y_value, edgecolors=None, s=9)
# 设置x,y轴的刻度,x[0,1001] y[1,100001]
plt.axis([0,1001,1,100001])
plt.show()
# 设置线条的颜色 默认蓝色
def test_7(self):
x_value = list(range(1, 1001))
y_value = [x**2 for x in x_value]
# 设置颜色
plt.scatter(x_value,y_value, edgecolors=None, s=9, c='red')
plt.axis([0,1001,1,100001])
plt.show()
# 使用颜色渐变 参数 cmap 告诉 pyplot 使用哪个颜色映射
def test_8(self):
x_value = list(range(1, 1001))
y_value = [x**2 for x in x_value]
# 设置颜色
plt.scatter(x_value,y_value, edgecolors=None, s=9, c= y_value, cmap=plt.cm.Blues)
plt.axis([0,1001,1,100001])
plt.show()
# 自动保存图
def test_9(self):
x_value = list(range(1, 1001))
y_value = [x**2 for x in x_value]
# 设置颜色
plt.scatter(x_value,y_value, edgecolors=None, s=9, c= y_value, cmap=plt.cm.Blues)
plt.axis([0,1001,1,100001])
# 第二个实参指定将图表多余的空白区域裁剪掉。如果要保留图表周围多余的空白区域,可省略这个实参
plt.savefig("xxx.png", bbox_inches='tight')
def test_10(self):
# x,y 对应关系
x_value = list(range(1, 1001))
y_value = [x**2 for x in x_value]
# 设置蓝色渐变
plt.scatter(x_value,y_value, edgecolors=None, s=9, c= y_value, cmap=plt.cm.Blues)
# 设置x ,y轴的标题
plt.xlabel("xlabel", fontsize=13)
plt.ylabel("ylabel",fontsize=13)
# 设置x,y轴刻度尺
plt.axis([0,1001,1,100001])
# 设置标题
plt.title("done with this page")
# 第二个实参指定将图表多余的空白区域裁剪掉。如果要保留图表周围多余的空白区域,可省略这个实参
plt.savefig("xxx.png", bbox_inches='tight')
class randomWalk():
def __init__(self, number_point = 5000):
print("随机漫步练习")
# 初始化属性
self.number_point = number_point
# 设置起点
self.x_values = [0]
self.y_values = [0]
def fill_walk(self):
while len(self.x_values) < self.number_point:
# 前进方向和前进距离
x_direction = choice([-1, 1])
x_distance = choice([0, 1, 2, 3, 4])
x_step = x_direction * x_distance
y_direction = choice([-1, 1])
y_distance = choice([0, 1, 2, 3, 4])
y_step = y_direction * y_distance
# 拒绝原地踏步
# if x_step =0 and y_step =0:
# continue
# 计算下一个X Y
next_x = self.x_values[-1] + x_step
next_y = self.y_values[-1] + y_step
self.x_values.append(next_x)
self.y_values.append(next_y)
print("done")
if __name__ == "__main__":
# 类的练习
dog1 = dog("dog_a", 12)
# dog1.sit()
# dog1.roll_over()
# 开启matplotlib的入门练习之旅
matplotlibTest = matPlot()
# matplotlibTest.test_1()
# matplotlibTest.test_2()
# matplotlibTest.test_3()
# matplotlibTest.test_4()
# matplotlibTest.test_5()
# matplotlibTest.test_6()
# matplotlibTest.test_7()
# matplotlibTest.test_8()
# matplotlibTest.test_9()
# matplotlibTest.test_10()
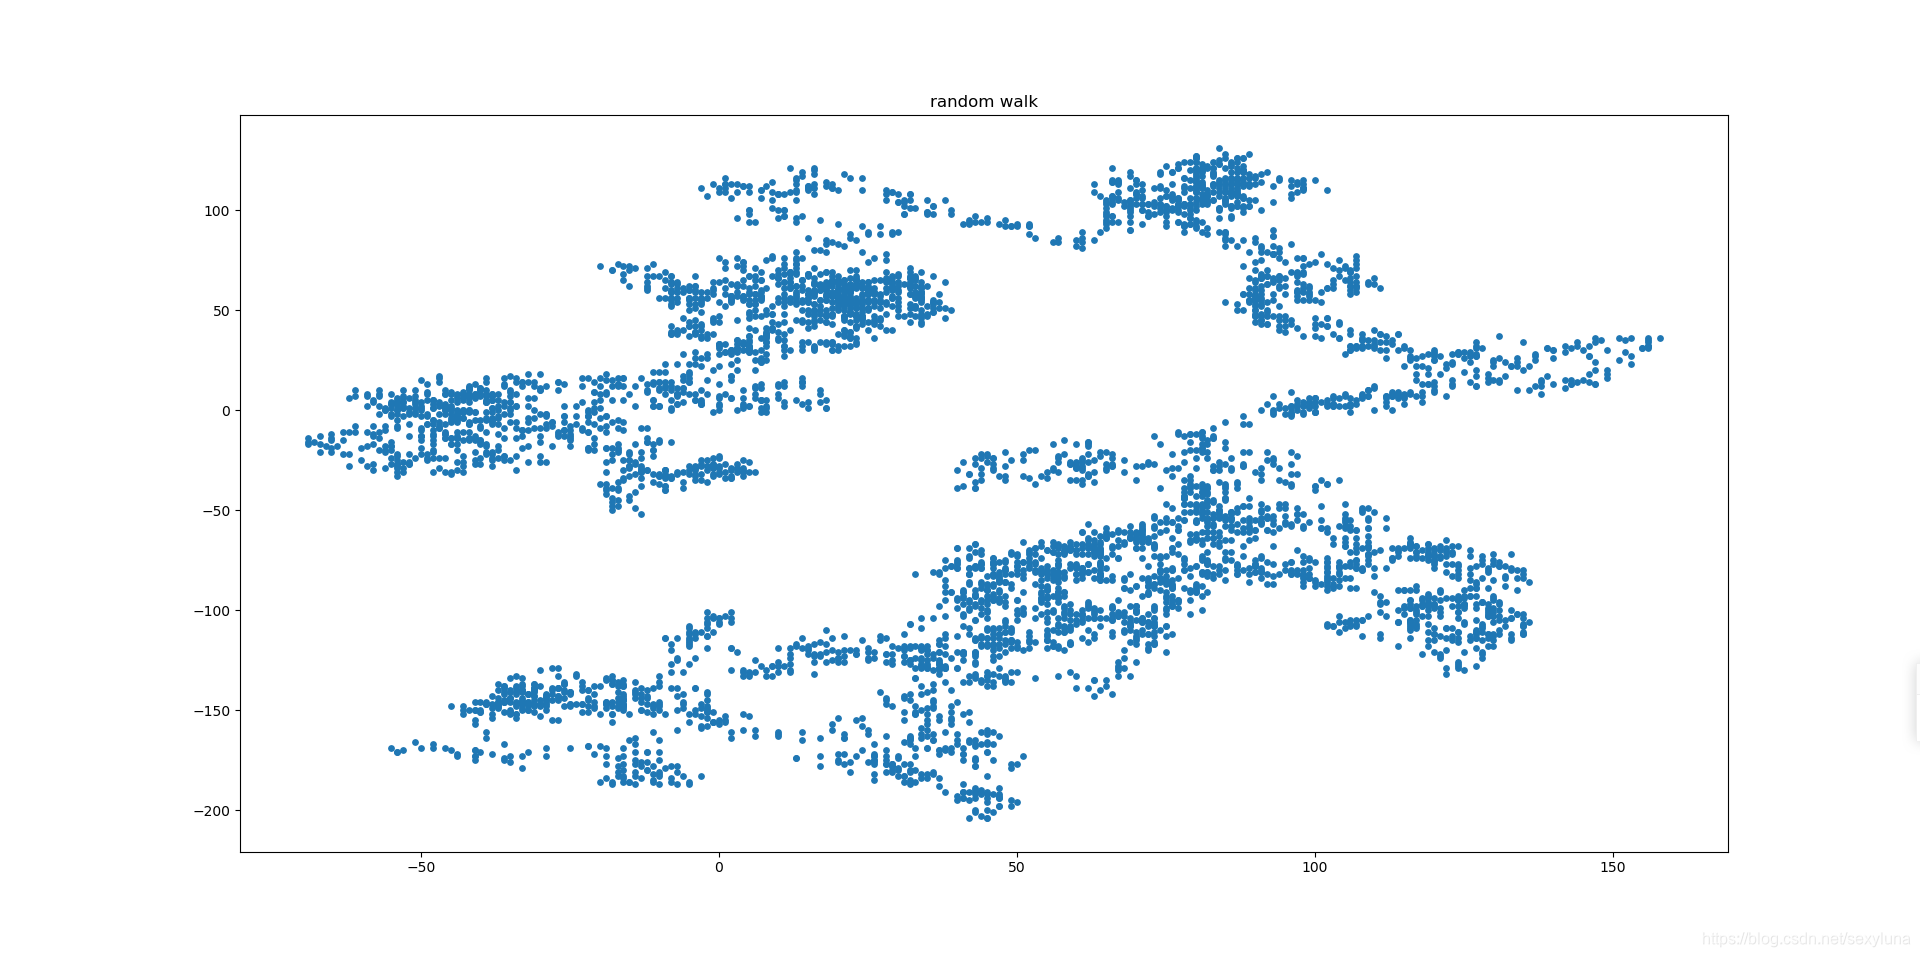
random_walk_test = randomWalk()
random_walk_test.fill_walk()
plt.scatter(random_walk_test.x_values, random_walk_test.y_values, s=15)
plt.title("random walk")
plt.show()
常见报错
python导入包失败ModuleNotFoundError: No module named ‘matplotlib.pyplot’; ‘matplotlib’ is not a package
文件名称命名问题,不要将文件名命名为matplotlib.py
