由之前的博客数据,绘制折线图
数据
['2016/07', '2016/10', '2016/11', '2016/12', '2017/01', '2017/02', '2017/03', '2017/04', '2017/06', '2017/07', '2017/08', '2017/09', '2017/10', '2017/11', '2017/12', '2018/01', '2018/02']
[6, 6, 11, 4, 35, 82, 52, 11, 40, 28, 53, 35, 34, 56, 29, 72, 80]
效果对比,上面的是百度的echarts,下面是chatjs
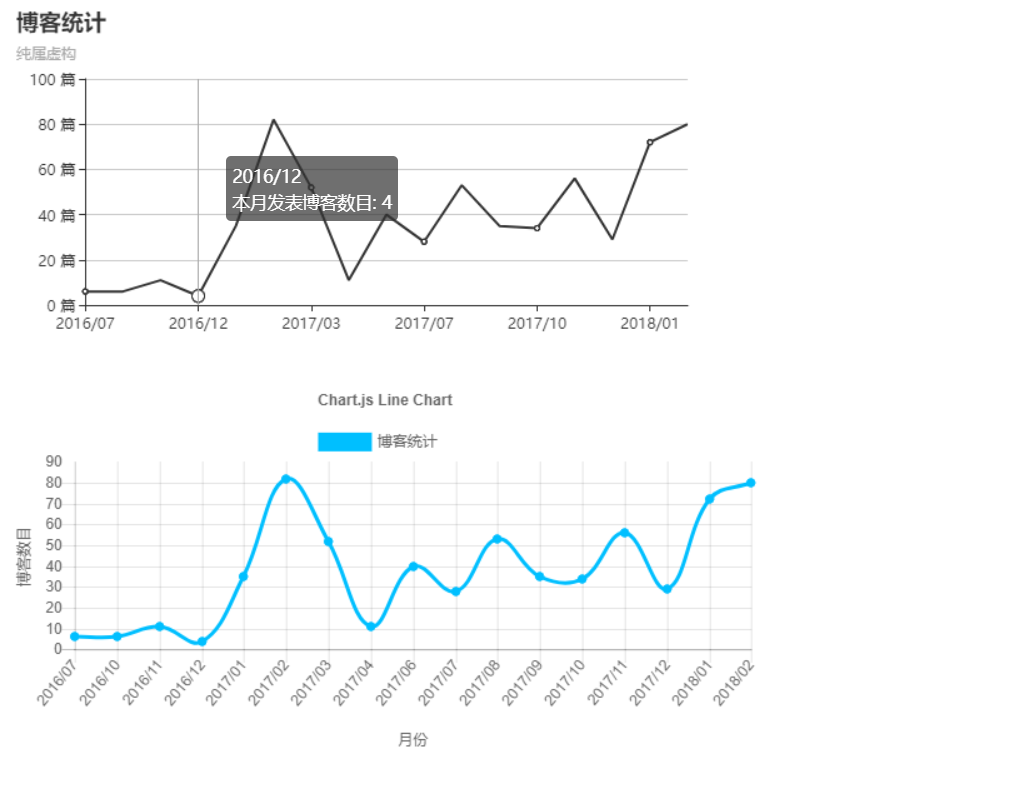
百度默认的样式不是很好看,可以使用自定义样式,感觉macarons看起来还行。
var myChart = echarts.init(dom, macarons);

echarts
<template>
  <div>
    <div class="chart" ref="chart"></div>
  </div>
</template>

<script>
  import echarts from 'echarts'
  import macarons from '../lib/macarons'

  export default {
    name: "blog-chart",
    mounted() {
      let dom = this.$refs.chart
      let option = {
        title: {
          text: '博客统计',
          subtext: '纯属虚构'
        },
        tooltip: {
          trigger: 'axis'
        },

        calculable: true,
        xAxis: [{
          type: 'category',
          boundaryGap: false,
          data: ['2016/07', '2016/10', '2016/11', '2016/12', '2017/01', '2017/02', '2017/03', '2017/04', '2017/06', '2017/07', '2017/08', '2017/09', '2017/10', '2017/11', '2017/12', '2018/01', '2018/02'],
        }],
        yAxis: [{
          type: 'value',
          axisLabel: {
            formatter: '{value} 篇'
          }
        }],
        series: [{
          name: '本月发表博客数目',
          type: 'line',
          data: [6, 6, 11, 4, 35, 82, 52, 11, 40, 28, 53, 35, 34, 56, 29, 72, 80],
        }
        ]
      };

      var myChart = echarts.init(dom, macarons);
      myChart.setOption(option, true);
    }
  }
</script>

<style scoped>

  .chart {
    width: 600px;
    height: 300px;
  }
</style>
chartjs
<template>
  <div class="chart">
    <canvas class="chart" ref="chart" id="chart"></canvas>
  </div>
</template>

<script>
  import Chart from 'chart'

  export default {
    name: "blog-chart2",
    mounted() {

      var config = {
        type: 'line',
        data: {
          labels: ['2016/07', '2016/10', '2016/11', '2016/12', '2017/01', '2017/02', '2017/03', '2017/04', '2017/06', '2017/07', '2017/08', '2017/09', '2017/10', '2017/11', '2017/12', '2018/01', '2018/02'],
          datasets: [{
            label: '博客统计',
            backgroundColor: 'deepskyblue',
            borderColor: 'deepskyblue',
            data: [6, 6, 11, 4, 35, 82, 52, 11, 40, 28, 53, 35, 34, 56, 29, 72, 80],
            fill: false,
          },]
        },
        options: {
          responsive: true,
          title: {
            display: true,
            text: 'Chart.js Line Chart'
          },
          tooltips: {
            mode: 'index',
            intersect: false,
          },
          hover: {
            mode: 'nearest',
            intersect: true
          },
          scales: {
            xAxes: [{
              display: true,
              scaleLabel: {
                display: true,
                labelString: '月份'
              }
            }],
            yAxes: [{
              display: true,
              scaleLabel: {
                display: true,
                labelString: '博客数目'
              }
            }]
          }
        }
      };

      window.onload = function () {
        var ctx = document.getElementById('chart').getContext('2d');
        window.myLine = new Chart(ctx, config);
      };
    }
  }
</script>

<style scoped>

  .chart {
    width: 600px;
    height: 300px;
  }
</style>
扫描二维码关注公众号,回复:
799747 查看本文章

百度echarts的样式文件macarons
var colorPalette = [
  '#2ec7c9', '#b6a2de', '#5ab1ef', '#ffb980', '#d87a80',
  '#8d98b3', '#e5cf0d', '#97b552', '#95706d', '#dc69aa',
  '#07a2a4', '#9a7fd1', '#588dd5', '#f5994e', '#c05050',
  '#59678c', '#c9ab00', '#7eb00a', '#6f5553', '#c14089'
];

let macarons = {
  color: colorPalette,

  title: {
    textStyle: {
      fontWeight: 'normal',
      color: '#008acd'
    }
  },

  visualMap: {
    itemWidth: 15,
    color: ['#5ab1ef', '#e0ffff']
  },

  toolbox: {
    iconStyle: {
      normal: {
        borderColor: colorPalette[0]
      }
    }
  },

  tooltip: {
    backgroundColor: 'rgba(50,50,50,0.5)',
    axisPointer: {
      type: 'line',
      lineStyle: {
        color: '#008acd'
      },
      crossStyle: {
        color: '#008acd'
      },
      shadowStyle: {
        color: 'rgba(200,200,200,0.2)'
      }
    }
  },

  dataZoom: {
    dataBackgroundColor: '#efefff',
    fillerColor: 'rgba(182,162,222,0.2)',
    handleColor: '#008acd'
  },

  grid: {
    borderColor: '#eee'
  },

  categoryAxis: {
    axisLine: {
      lineStyle: {
        color: '#008acd'
      }
    },
    splitLine: {
      lineStyle: {
        color: ['#eee']
      }
    }
  },

  valueAxis: {
    axisLine: {
      lineStyle: {
        color: '#008acd'
      }
    },
    splitArea: {
      show: true,
      areaStyle: {
        color: ['rgba(250,250,250,0.1)', 'rgba(200,200,200,0.1)']
      }
    },
    splitLine: {
      lineStyle: {
        color: ['#eee']
      }
    }
  },

  timeline: {
    lineStyle: {
      color: '#008acd'
    },
    controlStyle: {
      normal: {color: '#008acd'},
      emphasis: {color: '#008acd'}
    },
    symbol: 'emptyCircle',
    symbolSize: 3
  },

  line: {
    smooth: true,
    symbol: 'emptyCircle',
    symbolSize: 3
  },

  candlestick: {
    itemStyle: {
      normal: {
        color: '#d87a80',
        color0: '#2ec7c9',
        lineStyle: {
          color: '#d87a80',
          color0: '#2ec7c9'
        }
      }
    }
  },

  scatter: {
    symbol: 'circle',
    symbolSize: 4
  },

  map: {
    label: {
      normal: {
        textStyle: {
          color: '#d87a80'
        }
      }
    },
    itemStyle: {
      normal: {
        borderColor: '#eee',
        areaColor: '#ddd'
      },
      emphasis: {
        areaColor: '#fe994e'
      }
    }
  },

  graph: {
    color: colorPalette
  },

  gauge: {
    axisLine: {
      lineStyle: {
        color: [[0.2, '#2ec7c9'], [0.8, '#5ab1ef'], [1, '#d87a80']],
        width: 10
      }
    },
    axisTick: {
      splitNumber: 10,
      length: 15,
      lineStyle: {
        color: 'auto'
      }
    },
    splitLine: {
      length: 22,
      lineStyle: {
        color: 'auto'
      }
    },
    pointer: {
      width: 5
    }
  }
};

export default macarons