版权声明:本文为博主原创文章,未经博主允许不得转载。 https://blog.csdn.net/qq_20042935/article/details/89877374
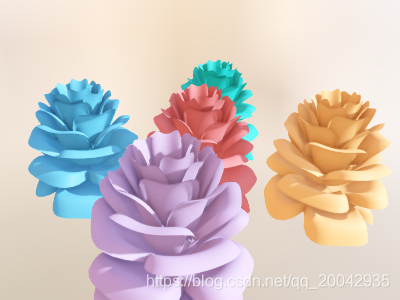
效果图
源代码
var sin = Math.sin;
var cos = Math.cos;
var pow = Math.pow;
var sqrt = Math.sqrt;
var cosh = Math.cosh;
var sinh = Math.sinh;
var exp = Math.exp;
var PI = Math.PI;
var square = function (x) {
    return x*x;
}
var mod2 = function (a, b) {
    var c = a % b;
    return c > 0 ? c : (c + b);
}

var theta1 = -(20/9) * PI;
var theta2 = 15 * PI;
function getParametricEquation(dx, dy) {
    return {
        u: {
            min: 0,
            max: 1,
            step: 1 / 24
        },
        v: {
            min: theta1,
            max: theta2,
            step: (theta2 - theta1) / 575
        },
        x: function (x1, theta) {
            var phi = (PI/2)*exp(-theta/(8*PI));
            var y1 = 1.9565284531299512*square(x1)*square(1.2768869870150188*x1-1)*sin(phi);
            var X = 1-square(1.25*square(1-mod2((3.6*theta),(2*PI))/PI)-0.25)/2;
            var r = X*(x1*sin(phi)+y1*cos(phi));
            return r * sin(theta) + dx;
        },
        y: function (x1, theta) {
            var phi = (PI/2)*exp(-theta/(8*PI));
            var y1 = 1.9565284531299512*square(x1)*square(1.2768869870150188*x1-1)*sin(phi);
            var X = 1-square(1.25*square(1-mod2((3.6*theta),(2*PI))/PI)-0.25)/2;
            var r = X*(x1*sin(phi)+y1*cos(phi));
            return r * cos(theta) + dy;
        },
        z: function (x1, theta) {
            var phi = (PI/2)*exp(-theta/(8*PI));
            var y1 = 1.9565284531299512*square(x1)*square(1.2768869870150188*x1-1)*sin(phi);
            var X = 1-square(1.25*square(1-mod2((3.6*theta),(2*PI))/PI)-0.25)/2;
            var r = X*(x1*sin(phi)+y1*cos(phi));
            return X*(x1*cos(phi)-y1*sin(phi));
        }
    };
}

function createSeries(dx, dy, color) {
    return {
        type: 'surface',
        parametric: true,
        shading: 'realistic',
        silent: true,
        wireframe: {
            show: false
        },
        realisticMaterial: {
            roughness: 0.7,
            metalness: 0,
            textureTiling: [200, 20]
        },
        parametricEquation: getParametricEquation(dx, dy)
    };
}

option = {
    toolbox: {
        feature: {
            saveAsImage: {
                backgroundColor: '#111'
            }
        },
        iconStyle: {
            normal: {
                borderColor: '#fff'
            }
        },
        left: 0
    },
    xAxis3D: {
        type: 'value'
    },
    yAxis3D: {
        type: 'value'
    },
    zAxis3D: {
        type: 'value'
    },
    grid3D: {

        show: false,
        boxWidth: 200,
        boxDepth: 200,

        axisPointer: {
            show: false
        },
        axisLine: {
            lineStyle: {
                color: '#fff'
            }
        },
        postEffect: {
            enable: true,
            SSAO: {
                enable: true,
                radius: 10,
                intensity: 1
            }
        },
        temporalSuperSampling: {
            enable: true
        },
        light: {
            main: {
                intensity: 1,
                shadow: true,
            },
            ambient: {
                intensity: 0
            },
            ambientCubemap: {
                texture: 'data-gl/asset/pisa.hdr',
                exposure: 1,
                diffuseIntensity: 1,
                specularIntensity: 1
            }
        },
        viewControl: {
            // projection: 'orthographic'
        }
    },
    series: [
        createSeries(1.5, 1.5),
        createSeries(-1.5, -1.5),
        createSeries(-1.5, 1.5),
        createSeries(1.5, -1.5),
        createSeries(0, 0),
    ]
};