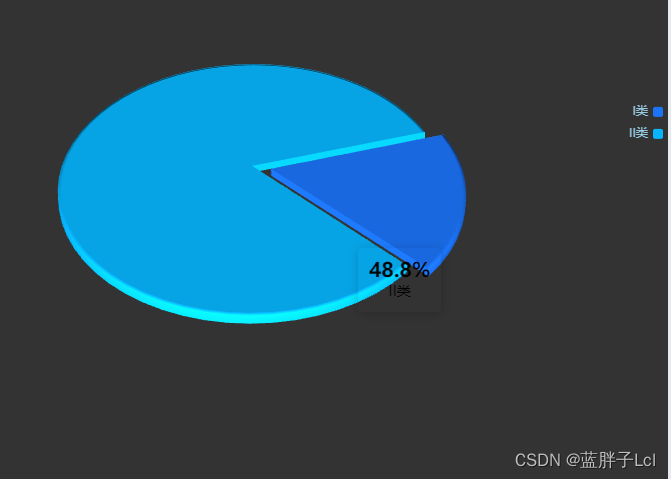
效果图
代码
const optionData=[{
name: 'I类',
value: 10.2,
itemStyle: {
color: '#1C74F8',
},
}, {
name: 'II类',
value: 48.8,
itemStyle: {
color: '#07B5FF',
},
}, ]
option = {
}
function init() {
option = getPie3D(optionData, 0.8);
console.log(option)
option.series.push({
name: 'pie2d',
labelLine: {
length: 10,
length2: 10,
},
startAngle: -30,
clockwise: false,
radius: ['20%', '50%'],
center: ['50%', '50%'],
data: optionData,
itemStyle: {
opacity: 0,
},
});
myChart.setOption(option);
bindListen();
}
function getPie3D(pieData, internalDiameterRatio) {
const series = [];
let sumValue = 0;
let startValue = 0;
let endValue = 0;
const legendData = [];
const k = 1
for (let i = 0; i < pieData.length; i += 1) {
sumValue += pieData[i].value;
const seriesItem = {
name: typeof pieData[i].name === 'undefined' ? `series${
i}` : pieData[i].name,
type: 'surface',
parametric: true,
wireframe: {
show: false,
},
pieData: pieData[i],
pieStatus: {
selected: false,
hovered: false,
k,
},
};
if (typeof pieData[i].itemStyle !== 'undefined') {
const {
itemStyle } = pieData[i];
typeof pieData[i].itemStyle.color !== 'undefined' ? (itemStyle.color = pieData[i].itemStyle.color) : null;
typeof pieData[i].itemStyle.opacity !== 'undefined'
? (itemStyle.opacity = pieData[i].itemStyle.opacity)
: null;
seriesItem.itemStyle = itemStyle;
}
series.push(seriesItem);
}
for (let i = 0; i < series.length; i += 1) {
endValue = startValue + series[i].pieData.value;
series[i].pieData.startRatio = startValue / sumValue;
series[i].pieData.endRatio = endValue / sumValue;
series[i].parametricEquation = getParametricEquation(
series[i].pieData.startRatio,
series[i].pieData.endRatio,
false,
false,
k,
series[i].pieData.value ,
);
startValue = endValue;
legendData.push(series[i].name);
}
const option = {
animation: true,
legend: {
orient: 'vertical',
data: legendData,
textStyle: {
color: 'rgba(150,202,223)',
fontSize: 12,
},
itemWidth: 10,
itemHeight: 10,
icon: 'roundRect',
left: 'right',
top: '30%',
},
tooltip: {
trigger: 'item',
backgroundColor: '#ffffff00',
borderColor: '#ffffff00',
formatter: (params) => {
if (params.seriesName !== 'mouseoutSeries') {
return `<div>
<p style="font-size:20px;color:#000;font-weight:bold;margin:0">${
option.series[params.seriesIndex].pieData.value}%</p>
<p style="color:#000;text-align:center;margin:0">${
params.seriesName
}</p></div>`;
}
return '';
},
},
labelLine: {
show: true,
lineStyle: {
color: '#7BC0CB',
},
},
label: {
show: true,
position: 'outside',
formatter: '{b} \n{c} {d}%',
},
backgroundColor: '#333',
xAxis3D: {
min: -1,
max: 1,
},
yAxis3D: {
min: -1,
max: 1,
},
zAxis3D: {
min: -1,
max: 1,
},
grid3D: {
show: false,
boxHeight: 2,
top: '-10%',
left: '5%',
viewControl: {
alpha: 40,
beta: 45,
rotateSensitivity: 0,
zoomSensitivity: 0,
panSensitivity: 0,
autoRotate: false,
distance: 500,
},
postEffect: {
enable: false,
bloom: {
enable: true,
bloomIntensity: 0.1,
},
SSAO: {
enable: true,
quality: 'medium',
radius: 1,
},
},
},
series,
};
return option;
}
function getHeight3D(series, height) {
series.sort((a, b) => (b.pieData.value - a.pieData.value));
return height * 25 / series[0].pieData.value;
}
function getParametricEquation(startRatio, endRatio, isSelected, isHovered, k, h) {
const midRatio = (startRatio + endRatio) / 2;
const startRadian = startRatio * Math.PI * 2;
const endRadian = endRatio * Math.PI * 2;
const midRadian = midRatio * Math.PI * 2;
if (startRatio === 0 && endRatio === 1) {
isSelected = false;
}
k = typeof k !== 'undefined' ? k : 1 / 3;
const offsetX = isHovered ? Math.cos(midRadian) * 0.2 : Math.cos(midRadian)*0.1;
const offsetY = isHovered ? Math.sin(midRadian) * 0.2: Math.sin(midRadian)*0.1;
const hoverRate = isHovered ? 1.01 : 1;
return {
u: {
min: -Math.PI,
max: Math.PI * 3,
step: Math.PI / 32,
},
v: {
min: 0,
max: Math.PI * 2,
step: Math.PI / 20,
},
x(u, v) {
if (u < startRadian) {
return offsetX + Math.cos(startRadian) * (1 + Math.cos(v) * k) * hoverRate;
}
if (u > endRadian) {
return offsetX + Math.cos(endRadian) * (1 + Math.cos(v) * k) * hoverRate;
}
return offsetX + Math.cos(u) * (1 + Math.cos(v) * k) * hoverRate;
},
y(u, v) {
if (u < startRadian) {
return offsetY + Math.sin(startRadian) * (1 + Math.cos(v) * k) * hoverRate;
}
if (u > endRadian) {
return offsetY + Math.sin(endRadian) * (1 + Math.cos(v) * k) * hoverRate;
}
return offsetY + Math.sin(u) * (1 + Math.cos(v) * k) * hoverRate;
},
z(u, v) {
if (u < -Math.PI * 0.5) {
return Math.sin(u);
}
if (u > Math.PI * 2.5) {
return Math.sin(u) * h * 0.1;
}
return Math.sin(v) > 0 ? 1 * h * 0.1 : -1;
},
};
}
function fomatFloat(num, n) {
let f = parseFloat(num);
if (isNaN(f)) {
return false;
}
f = Math.round(num * Math.pow(10, n)) / Math.pow(10, n);
let s = f.toString();
let rs = s.indexOf('.');
if (rs < 0) {
rs = s.length;
s += '.';
}
while (s.length <= rs + n) {
s += '0';
}
return s;
}
function bindListen() {
const that = this;
let selectedIndex = '';
let hoveredIndex = '';
myChart.on('click', (params) => {
const isSelected = !that.option.series[params.seriesIndex].pieStatus.selected;
const isHovered = that.option.series[params.seriesIndex].pieStatus.hovered;
const {
k } = that.option.series[params.seriesIndex].pieStatus;
const {
startRatio } = that.option.series[params.seriesIndex].pieData;
const {
endRatio } = that.option.series[params.seriesIndex].pieData;
if (selectedIndex !== '' && selectedIndex !== params.seriesIndex) {
that.option.series[selectedIndex].parametricEquation = that.getParametricEquation(that.option.series[
selectedIndex].pieData
.startRatio, that.option.series[selectedIndex].pieData.endRatio, false, false, k, that.option.series[
selectedIndex].pieData
.value);
that.option.series[selectedIndex].pieStatus.selected = false;
}
that.option.series[params.seriesIndex].parametricEquation = that.getParametricEquation(startRatio, endRatio,
isSelected,
isHovered, k, 80);
that.option.series[params.seriesIndex].pieStatus.selected = isSelected;
isSelected ? selectedIndex = params.seriesIndex : null;
myChart.setOption(that.option);
});
myChart.on('mouseover', (params) => {
let isSelected;
let isHovered;
let startRatio;
let endRatio;
let k;
if (hoveredIndex === params.seriesIndex) {
} else {
if (hoveredIndex !== '') {
isSelected = that.option.series[hoveredIndex].pieStatus.selected;
isHovered = false;
startRatio = that.option.series[hoveredIndex].pieData.startRatio;
endRatio = that.option.series[hoveredIndex].pieData.endRatio;
k = that.option.series[hoveredIndex].pieStatus.k;
that.option.series[hoveredIndex].parametricEquation = that.getParametricEquation(startRatio, endRatio,
isSelected,
isHovered, k, 35);
that.option.series[hoveredIndex].pieStatus.hovered = isHovered;
hoveredIndex = '';
}
if (params.seriesName !== 'mouseoutSeries' && params.seriesName !== 'pie2d') {
isSelected = that.option.series[params.seriesIndex].pieStatus.selected;
isHovered = true;
startRatio = that.option.series[params.seriesIndex].pieData.startRatio;
endRatio = that.option.series[params.seriesIndex].pieData.endRatio;
k = that.option.series[params.seriesIndex].pieStatus.k;
that.option.series[params.seriesIndex].parametricEquation = that.getParametricEquation(startRatio, endRatio,
isSelected, isHovered, k, 80);
that.option.series[params.seriesIndex].pieStatus.hovered = isHovered;
hoveredIndex = params.seriesIndex;
}
myChart.setOption(that.option);
}
});
myChart.on('globalout', () => {
let isSelected;
let isHovered;
let startRatio;
let endRatio;
let k;
if (hoveredIndex !== '') {
isSelected = that.option.series[hoveredIndex].pieStatus.selected;
isHovered = false;
k = that.option.series[hoveredIndex].pieStatus.k;
startRatio = that.option.series[hoveredIndex].pieData.startRatio;
endRatio = that.option.series[hoveredIndex].pieData.endRatio;
that.option.series[hoveredIndex].parametricEquation = that.getParametricEquation(startRatio, endRatio,
isSelected,
isHovered, k, 35);
that.option.series[hoveredIndex].pieStatus.hovered = isHovered;
hoveredIndex = '';
}
myChart.setOption(that.option);
});
}
init()
````