var myChart = echarts.init(document.getElementById(id));
option = {
color: [’#bb0004’, ‘#FFD48A’],
tooltip: {
trigger: ‘axis’,
axisPointer: { // 坐标轴指示器,坐标轴触发有效
type: ‘shadow’ // 默认为直线,可选为:‘line’ | ‘shadow’
}
},
grid: {
// containLabel: true,
left: ‘10%’,
top: “9%”,
bottom: “10%”,
},
xAxis: {
data: [
‘一季度’,
‘二季度’,
‘三季度’,
‘四季度’
],
axisTick: {
show: false
},
axisLabel: {
color: ‘#5EA2ED’,
interval: 0
},
axisLine: {
lineStyle: {
color: ‘#1B5BBA’,
}
}
},
yAxis: {
splitLine: { show: false },
axisLine: {
lineStyle: {
color: ‘#1B5BBA’,
}
},
axisLabel: {
color: ‘#5EA2ED’,
interval: 0
},
},
series: [{
type: ‘pictorialBar’,
name: ‘案件归类’,
symbolSize: [‘50%’, ‘80%’],
// symbolPosition: ‘center’,
z: 10,
label: {
normal: {
show: true,
position: “top”,
formatter: “{c}”,
color: “#fff”,
fontSize: 13
}
},
data: [{
value: 152,
// symbolPosition: ‘center’,
symbolOffset: [0, -8],
// symbolRotate: -9,
// symbolPosition: ‘start’,
symbol: ‘image://…/img/column1.png’,
}, {
value: 380,
// symbolPosition: ‘center’,
symbolOffset: [0, -8],
symbol: ‘image://…/img/column2.png’,
}, {
value: 291,
// symbolPosition: ‘center’,
symbolOffset: [0, -8],
symbol: ‘image://…/img/column3.png’,
}, {
value: 369,
symbolOffset: [0, -8],
symbol: ‘image://…/img/column4.png’,
}]
}]
};
myChart.setOption(option);
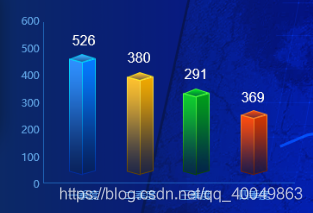
echarts 3D 柱形图
猜你喜欢
转载自blog.csdn.net/qq_40049863/article/details/94740729
今日推荐
周排行