版权声明:本文为博主原创文章,未经博主允许不得转载。 https://blog.csdn.net/qq_20042935/article/details/89877459
效果图
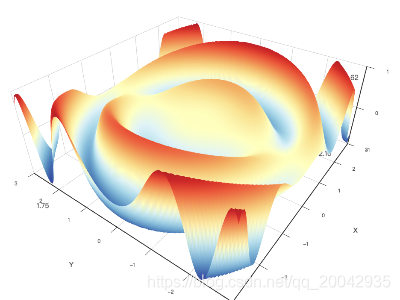
源代码
option = {
    tooltip: {},
    backgroundColor: '#fff',
    visualMap: {
        show: false,
        dimension: 2,
        min: -1,
        max: 1,
        inRange: {
            color: ['#313695', '#4575b4', '#74add1', '#abd9e9', '#e0f3f8', '#ffffbf', '#fee090', '#fdae61', '#f46d43', '#d73027', '#a50026']
        }
    },
    xAxis3D: {
        type: 'value'
    },
    yAxis3D: {
        type: 'value'
    },
    zAxis3D: {
        type: 'value',
        max: 1,
        splitNumber: 2
    },
    grid3D: {
        viewControl: {
            // projection: 'orthographic'
        },
        boxHeight: 40
    },
    series: [{
        type: 'surface',
        wireframe: {
            show: false
        },
        shading: 'color',
        equation: {
            x: {
                step: 0.05,
                min: -3,
                max: 3,
            },
            y: {
                step: 0.05,
                min: -3,
                max: 3,
            },
            z: function (x, y) {
                return Math.sin(x * x + y * y) * x / 3.14
            }
        }
    }]
}