版权声明:本文为博主原创文章,未经博主允许不得转载。 https://blog.csdn.net/qq_20042935/article/details/89709018
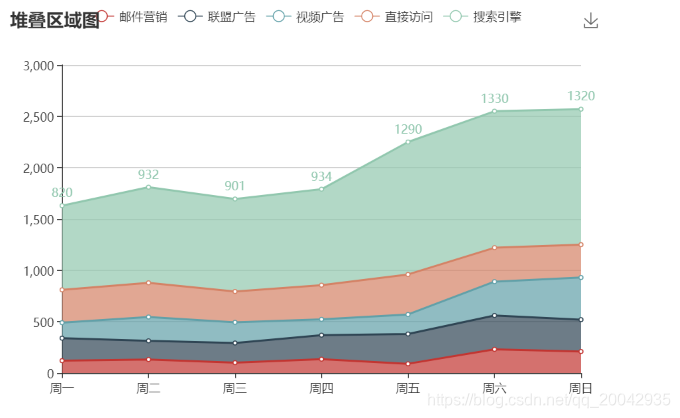
效果图
源代码
<!DOCTYPE html>
<html>

	<head>
		<meta charset="utf-8">
		<title>ECharts</title>
		<!-- 引入 echarts.js -->
		<script src="js/echarts.min.js"></script>
	</head>

	<body>
		<!-- 为ECharts准备一个具备大小(宽高)的Dom -->
		<div id="main" style="width: 600px;height:400px;"></div>
		<script type="text/javascript">
			// 基于准备好的dom,初始化echarts实例
			var myChart = echarts.init(document.getElementById('main'));

			// 指定图表的配置项和数据
			var option = {
				title: {
					text: '堆叠区域图'
				},
				tooltip: {
					trigger: 'axis',
					axisPointer: {
						type: 'cross',
						label: {
							backgroundColor: '#6a7985'
						}
					}
				},
				legend: {
					data: ['邮件营销', '联盟广告', '视频广告', '直接访问', '搜索引擎']
				},
				toolbox: {
					feature: {
						saveAsImage: {}
					}
				},
				grid: {
					left: '3%',
					right: '4%',
					bottom: '3%',
					containLabel: true
				},
				xAxis: [{
					type: 'category',
					boundaryGap: false,
					data: ['周一', '周二', '周三', '周四', '周五', '周六', '周日']
				}],
				yAxis: [{
					type: 'value'
				}],
				series: [{
						name: '邮件营销',
						type: 'line',
						stack: '总量',
						areaStyle: {},
						data: [120, 132, 101, 134, 90, 230, 210]
					},
					{
						name: '联盟广告',
						type: 'line',
						stack: '总量',
						areaStyle: {},
						data: [220, 182, 191, 234, 290, 330, 310]
					},
					{
						name: '视频广告',
						type: 'line',
						stack: '总量',
						areaStyle: {},
						data: [150, 232, 201, 154, 190, 330, 410]
					},
					{
						name: '直接访问',
						type: 'line',
						stack: '总量',
						areaStyle: {
							normal: {}
						},
						data: [320, 332, 301, 334, 390, 330, 320]
					},
					{
						name: '搜索引擎',
						type: 'line',
						stack: '总量',
						label: {
							normal: {
								show: true,
								position: 'top'
							}
						},
						areaStyle: {
							normal: {}
						},
						data: [820, 932, 901, 934, 1290, 1330, 1320]
					}
				]
			};

			// 使用刚指定的配置项和数据显示图表。
			myChart.setOption(option);
		</script>
	</body>

</html>
