本章主要总结几个概念性的东西:
- target shuffle:discern between signal and noise
- confidence intervals | the level of confidence
- QQ-plots:利用该图判定数据是否服从正态分布
- long-tailed distribution
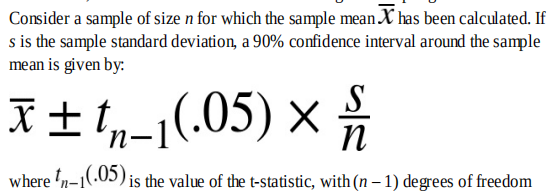
- t-distribution
- binomial distribution
- possion distribution | exponential distribution | weibull distribution
1、target shuffle:当你训练了一个model后,想要验证model的预测效果,可以首先用model预测若干sample的label,然后将这些label重新shuffle,得到label*,将这2种label与sample实际的label_y进行比较,如果label与label_y大部分相同,而label*与label_y仅有几例是相同的,说明,model能够有效预测sample。target shuffle这种方法可以convince client to believe the model。
参考文章:target shuffle
2、confidence interval(置信区间) && the level of confidence(置信度)
置信区间 一般与 置信度 相对应,如下图所示:90%的置信度 对应的 置信区间为:[53610,62279]。

对于上述置信度和置信区间,我们可以这样理解:我们有90%的把握说,总体的真值在[53610,62279]区间内。
一般,置信度越小,置信区间越窄。
3、在真实世界,鲜少有raw data服从normal distribution,要判断一个raw data是否服从normal distribution(Guassian),我们可以通过如下步骤进行判断:
step1:将raw data中的value进行z-score转换,记为Z;(z-score就是将value进行如下转化:(value - mean)/std )
step2:将Z进行升序排序;
step3:plots each value’s z-score on the y-axis; the x-axis is the corresponding quantile of a normal distribution for that value’s rank.
step4:If the points roughly fall on the diagonal line, then the sample distribution can be considered close to normal.
在R中的代码实现如下:
norm_samp <- rnorm(100)
qqnorm(norm_samp)
abline(a=0, b=1, col='grey')

4、介绍几种分布
- long-tailed distribution
Most data is not normally distributed.
Assuming a normal distribution can lead to underestimation of extreme events,下图为QQ-plot,图中展现了long-tailed distribution 与 normal distribution的区别,从图中可以看出,在long-tailed distribution中,极值部分 都与 normal dsitribution(diagonal line)不重叠,long-tailed distribution更能代表“实际数据的分布”。
除此以外,从图中还可以看出,在均值的1个标准差范围内,long-tailed distribution接近line。

在实际中,对于raw data的distribution要根据“领域经验”和“统计知识”一起判断。比如,拟合“events per time period”,可以采用Possion distribution。 - Student’s t-Distribution
- The t-distribution is actually a family of distributions resembling the normal distribution, but with thicker tails.
- It is widely used as a reference basis for the distribution of sample means, differerences between two sample means, regression parameters, and other sample statistics.
- sample数量越大,其拟合的t-distribution越接近于normal distribution.
- Binomial distribution
- Binomial outcomes are important to model, since they represent, among other things, fundamental decisions (buy or don’t buy, click or don’t click, survive or die, etc.).
- A binomial trial is an experiment with two possible outcomes: one with probability p and the other with probability 1 – p.
- With large n, and provided p is not too close to 0 or 1, the binomial distribution can be approximated by the normal distribution.
- Possion and related distribution
| Distribution | Parameter | 描述事件 |
|---|---|---|
| Possion distribution | lambda:The rate (per unit of time or space) at which events occur ;lambda = mean = variance | The frequency distribution of the number of events in sampled units of time or space. |
| Exponential distribution | lambda:The rate (per unit of time or space) at which events occur ; | The frequency distribution of the time or distance from one event to the next event. |
| Weibull distribution | Weibull distribution中有2个参数,一个是shape parameter “beta”:用于刻画event rate,If “beta>1”,the probability of an event increases over time, if “beta< 1”, it decreases;另一个是scale parameter “eta”,用于刻画“特征寿命”, | A generalized version of the exponential, in which the event rate is allowed to shift over time. |