1、Normal distribution

In probability theory, the normal (or Gaussian or Gauss or Laplace–Gauss) distribution is a very common continuous probability distribution. Normal distributions are important in statistics and are often used in the natural and social sciences to represent real-valued random variables whose distributions are not known. A random variable with a Gaussian distribution is said to be normally distributed and is called a normal deviate.
The normal distribution is useful because of the central limit theorem. In its most general form, under some conditions (which include finite variance), it states that averages of samples of observations of random variables independently drawn from independent distributions converge in distribution to the normal, that is, they become normally distributed when the number of observations is sufficiently large. Physical quantities that are expected to be the sum of many independent processes (such as measurement errors) often have distributions that are nearly normal. Moreover, many results and methods (such as propagation of uncertainty and least squares parameter fitting) can be derived analytically in explicit form when the relevant variables are normally distributed.
The normal distribution is sometimes informally called the bell curve. However, many other distributions are bell-shaped (such as the Cauchy, Student's t-, and logistic distributions).
link:https://en.wikipedia.org/wiki/Normal_distribution
https://www.mathsisfun.com/data/standard-normal-distribution.html
2、Poisson Distribution
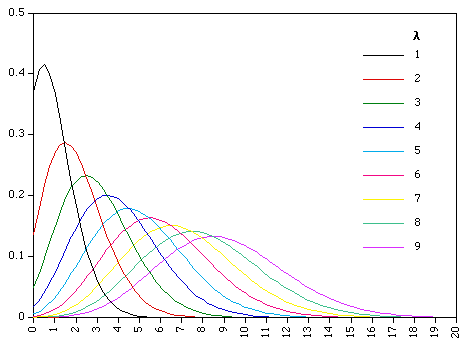
In probability theory and statistics, the Poisson distribution (French pronunciation: ; in English often rendered /ˈpwɑːsɒn/), named after French mathematician Siméon Denis Poisson, is a discrete probability distribution that expresses the probability of a given number of events occurring in a fixed interval of time or space if these events occur with a known constant rate and independently of the time since the last event. The Poisson distribution can also be used for the number of events in other specified intervals such as distance, area or volume.
For instance, an individual keeping track of the amount of mail they receive each day may notice that they receive an average number of 4 letters per day. If receiving any particular piece of mail does not affect the arrival times of future pieces of mail, i.e., if pieces of mail from a wide range of sources arrive independently of one another, then a reasonable assumption is that the number of pieces of mail received in a day obeys a Poisson distribution. Other examples that may follow a Poisson distribution include the number of phone calls received by a call center per hour and the number of decay events per second from a radioactive source.
link:https://en.wikipedia.org/wiki/Poisson_distribution
https://www.umass.edu/wsp/resources/poisson/
3、Chi-squared distribution

In probability theory and statistics, the chi-square distribution (also chi-squared or χ2-distribution) with k degrees of freedom is the distribution of a sum of the squares of k independent standard normal random variables. The chi-square distribution is a special case of the gamma distribution and is one of the most widely used probability distributions in inferential statistics, notably in hypothesis testing or in construction of confidence intervals. When it is being distinguished from the more general noncentral chi-square distribution, this distribution is sometimes called the central chi-square distribution.
The chi-square distribution is used in the common chi-square tests for goodness of fit of an observed distribution to a theoretical one, the independence of two criteria of classification of qualitative data, and in confidence interval estimation for a population standard deviation of a normal distribution from a sample standard deviation. Many other statistical tests also use this distribution, such as Friedman's analysis of variance by ranks.
link:https://en.wikipedia.org/wiki/Chi-squared_distribution
http://mathworld.wolfram.com/Chi-SquaredDistribution.html
https://www.itl.nist.gov/div898/handbook/eda/section3/eda3666.html
4、Beta distribution
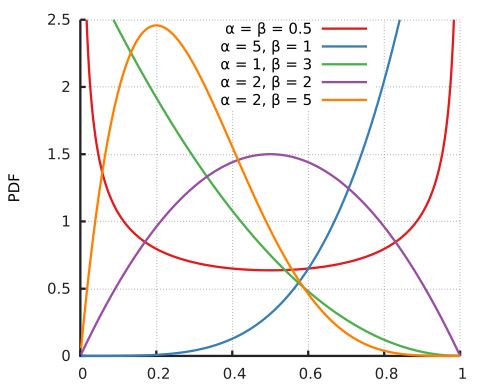
In probability theory and statistics, the beta distribution is a family of continuous probability distributions defined on the interval parametrized by two positive shape parameters, denoted by α and β, that appear as exponents of the random variable and control the shape of the distribution. It is a special case of the Dirichlet distribution.
The beta distribution has been applied to model the behavior of random variables limited to intervals of finite length in a wide variety of disciplines.
In Bayesian inference, the beta distribution is the conjugate prior probability distribution for the Bernoulli, binomial, negative binomial and geometric distributions. For example, the beta distribution can be used in Bayesian analysis to describe initial knowledge concerning probability of success such as the probability that a space vehicle will successfully complete a specified mission. The beta distribution is a suitable model for the random behavior of percentages and proportions.
The usual formulation of the beta distribution is also known as the beta distribution of the first kind, whereas beta distribution of the second kind is an alternative name for the beta prime distribution.
link:https://en.wikipedia.org/wiki/Beta_distribution