1.sqrt转换
先看序列的trend,如果有二次曲线的表现形式的话,可以做个sqrt
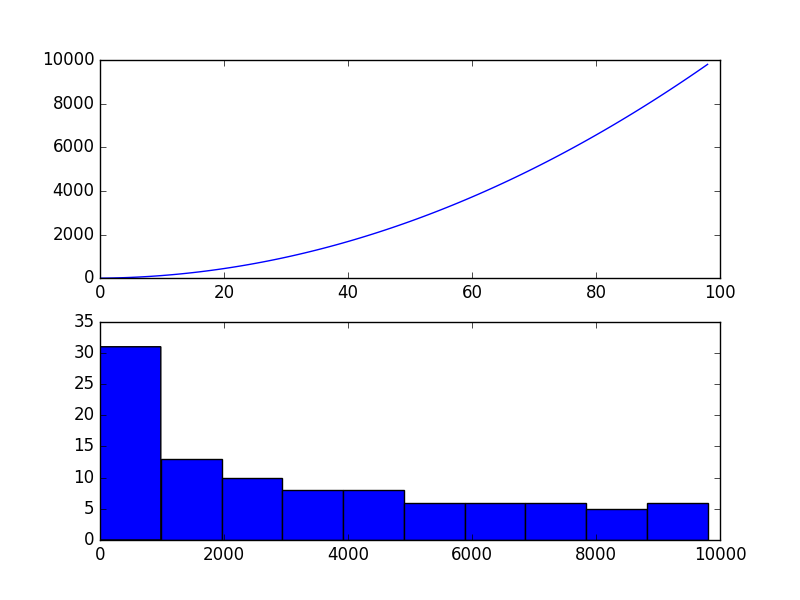
昨晚sqrt之后张成这样子
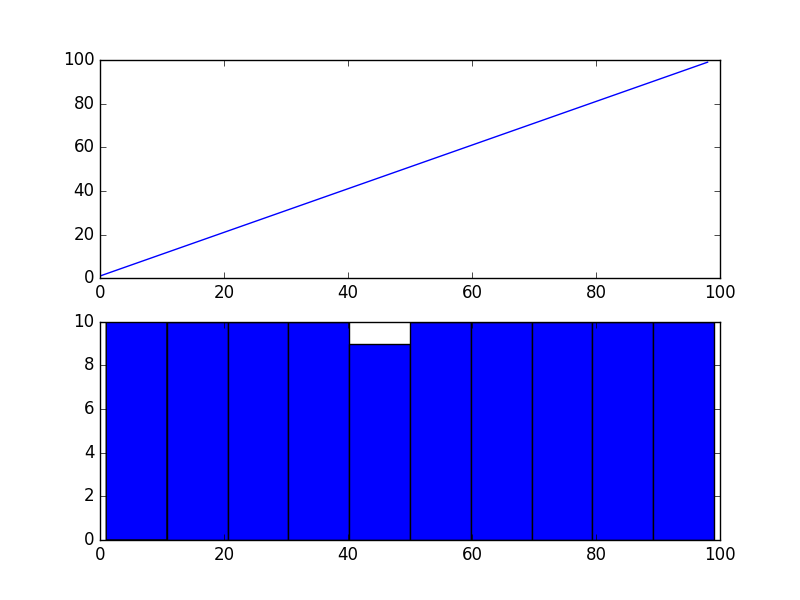
原来的数据长这样:
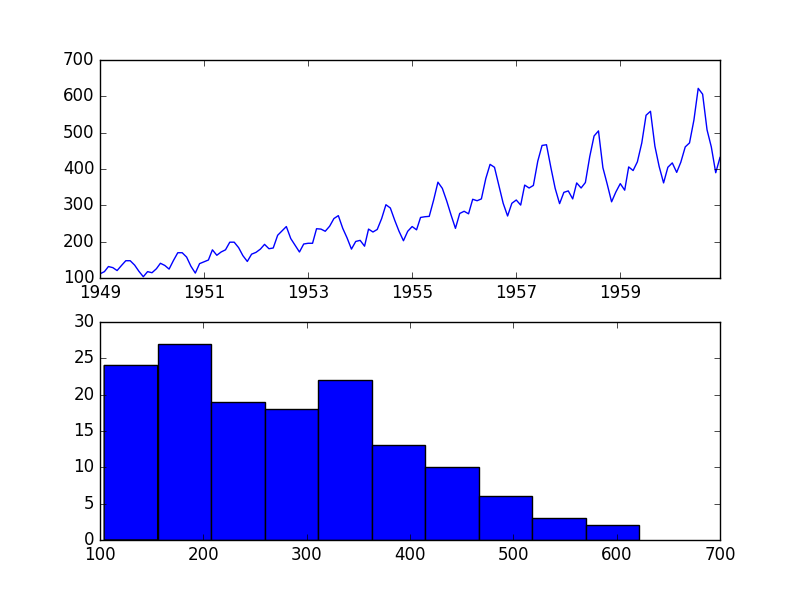
做个sqrt
from pandas import Series
from pandas import DataFrame
from numpy import sqrt
from matplotlib import pyplot
series = Series.from_csv('airline-passengers.csv', header=0)
dataframe = DataFrame(series.values)
dataframe.columns = ['passengers']
dataframe['passengers'] = sqrt(dataframe['passengers'])
pyplot.figure(1)
# line plot
pyplot.subplot(211)
pyplot.plot(dataframe['passengers'])
# histogram
pyplot.subplot(212)
pyplot.hist(dataframe['passengers'])
pyplot.show()
变成这个样子:
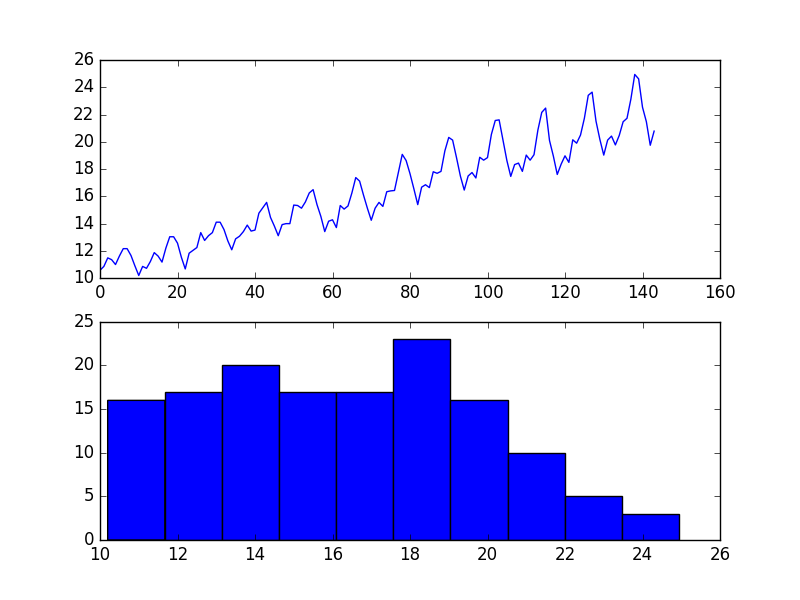
还是有趋势啊。。。。
2.log转换
昨晚log之后也应该张这样子
利用上面的真实数据做log
from pandas import Series
from pandas import DataFrame
from numpy import log
from matplotlib import pyplot
series = Series.from_csv('airline-passengers.csv', header=0)
dataframe = DataFrame(series.values)
dataframe.columns = ['passengers']
dataframe['passengers'] = log(dataframe['passengers'])
pyplot.figure(1)
# line plot
pyplot.subplot(211)
pyplot.plot(dataframe['passengers'])
# histogram
pyplot.subplot(212)
pyplot.hist(dataframe['passengers'])
pyplot.show()
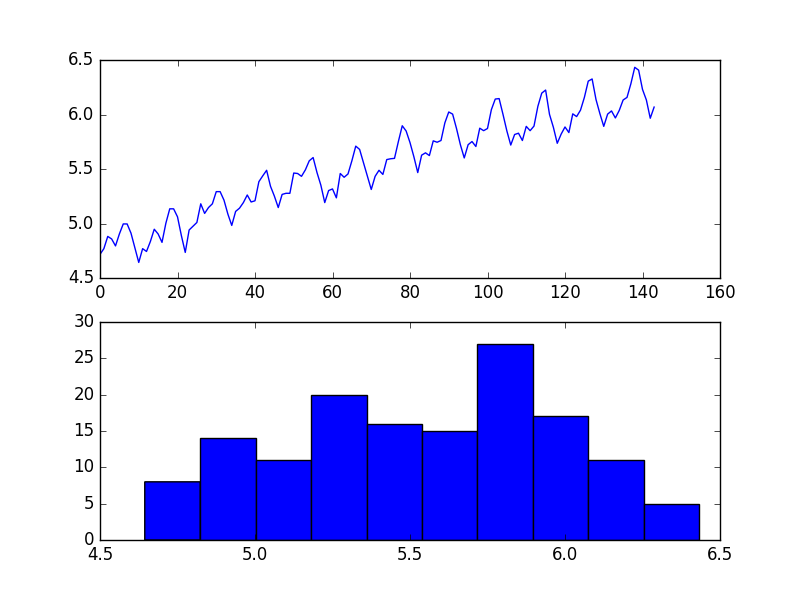
表现的更加正态了,log转换很受欢迎
3.box-cox转换

结果图如上
https://machinelearningmastery.com/power-transform-time-series-forecast-data-python/
- lambda = -1. is a reciprocal transform.
- lambda = -0.5 is a reciprocal square root transform.
- lambda = 0.0 is a log transform.
- lambda = 0.5 is a square root transform.
- lambda = 1.0 is no transform.
-
from pandas import Series
from pandas import DataFrame
from scipy.stats import boxcox
from matplotlib import pyplot
series = Series.from_csv('airline-passengers.csv', header=0)
dataframe = DataFrame(series.values)
dataframe.columns = ['passengers']
dataframe['passengers'] = boxcox(dataframe['passengers'], lmbda=0.0)
pyplot.figure(1)
# line plot
pyplot.subplot(211)
pyplot.plot(dataframe['passengers'])
# histogram
pyplot.subplot(212)
pyplot.hist(dataframe['passengers'])
pyplot.show()
这里举了个log的例子
-
-
神奇的是,他可以自己选一个lambda
-
We can set the lambda parameter to None (the default) and let the function find a statistically tuned value.
The following example demonstrates this usage, returning both the transformed dataset and the chosen lambda value.
-
from pandas import Series
from pandas import DataFrame
from scipy.stats import boxcox
from matplotlib import pyplot
series = Series.from_csv('airline-passengers.csv', header=0)
dataframe = DataFrame(series.values)
dataframe.columns = ['passengers']
dataframe['passengers'], lam = boxcox(dataframe['passengers'])
print('Lambda: %f' % lam)
pyplot.figure(1)
# line plot
pyplot.subplot(211)
pyplot.plot(dataframe['passengers'])
# histogram
pyplot.subplot(212)
pyplot.hist(dataframe['passengers'])
pyplot.show()
mbda: 0.148023
1
Lambda: 0.148023