# -*- coding: utf-8 -*-
# 导入需要的库
import numpy as np
import matplotlib.pyplot as plt
# 定义存储输入数据x,目标数据y
x,y = [],[]
# 遍历数据集,并把数据按照顺序存在对应的list
# 在文件中遍历,文件是一行一行的,每次读取的是一行数据
for sample in open("_Data/prices.txt","r"):
# 每一行,有两个数据,用逗号分开
x_,y_ = sample.split(",")
# 转化为浮点数据,
x.append(float(x_))
y.append(float(y_))
# 获取到数据之后,转化为numpy数据,因为他们经过优化之后,计算特别快
x,y = np.array(x),np.array(y)
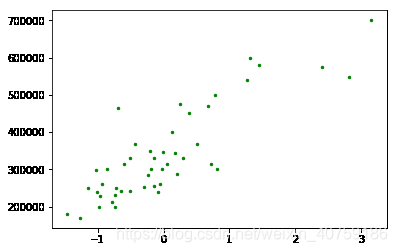
# 标准化
x = (x-x.mean())/x.std()
# 画图
plt.figure()
plt.scatter(x,y,c="g",s=6)
plt.show()
#%%
# 这个模型得到是一个多项式的函数,根据x0和多项式的函数,画出图形
x0 = np.linspace(-2,4,100)
# deg是多项式的参数,准确是多项式的阶,np.polyfit是是fit之后的参数,
# np.polyval根据参数和输入x,求在计算的y,注意这里lamda的用法
def get_model(deg):
return lambda input_x =x0:np.polyval(np.polyfit(x,y,deg),input_x)
# 根据参数n,和输入x,y求损失
def get_cost(deg,input_x,input_y):
return 0.5*((get_model(deg)(input_x)-input_y)**2).sum()
# 定义数据集
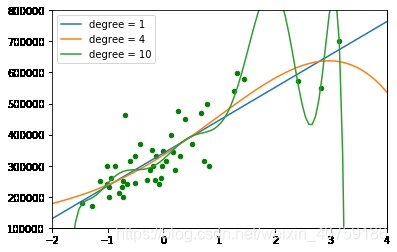
test_set = (1,4,10)
for degree in test_set:
print(get_cost(degree,x,y))
#%%
#画出对应的图像
plt.scatter(x,y,c="g",s=20)
for degree in test_set:
plt.plot(x0,get_model(degree)(),label="degree = {}".format(degree))
# x,y轴区间限制,1e5,8e5 10^5,8*10^5
plt.xlim(-2,4)
plt.ylim(1e5,8e5)
# 显示label
plt.legend()
plt.show()
测试结果
runfile(‘D:/share/test/repression.py’, wdir=‘D:/share/test’)
96732238800.35297
94112406641.67743
75874846680.09282