import matplotlib.pyplot as plt
from sklearn.datasets import load_boston
from sklearn.linear_model import LinearRegression
from matplotlib.font_manager import FontProperties
#这个属性设置是让matplot画图时显示中文的标签
font = FontProperties(fname=r"C:\Windows\Fonts\msyh.ttc", size=12)
#加载数据集
boston = load_boston()
#获取训练集
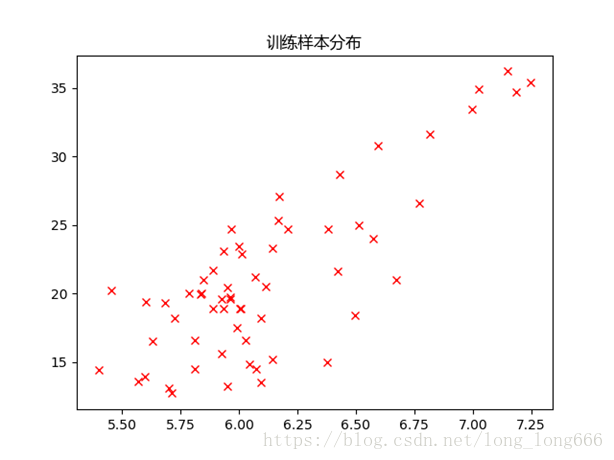
x = boston.data[:60, 5].reshape(-1, 1) #自变量取房间个数,训练样本60
y = boston.target[:60].reshape(-1, 1) #因变量为房屋价钱
#样本分布
plt.title("训练样本分布",fontproperties=font)
plt.plot(x, y, 'rx')
plt.show()
#一元线性回归函数:y=a+bx
model = LinearRegression()
#训练集数据放入模型中
model.fit(x, y)
#获取预测集
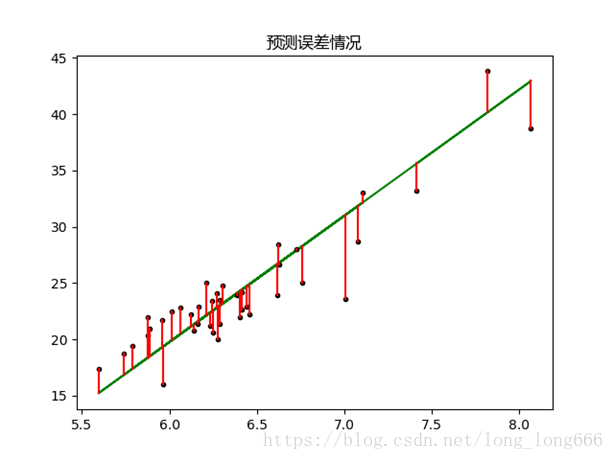
x1 = boston.data[60:100, 5].reshape(-1, 1)
y1 = model.predict(x1) #预测数据
plt.plot(x1, y1, 'g-')
#对比预测误差
y2 = boston.target[60:100].reshape(-1, 1) #实际数据
plt.plot(x1, y2, 'k.')
for idx, x in enumerate(x1):
plt.plot([x, x], [y1[idx], y2[idx]], 'r-')
plt.title("预测误差情况",fontproperties=font)
plt.show()
打印结果: