import numpy as np # 导入科学技术框架
import matplotlib.pyplot as plt # 导入画图工具
from sklearn.linear_model import LinearRegression # 导入sklearn机器学习库
x = 3 * np.random.rand(100, 1)
y = 3 + 4 * x + np.random.rand(100, 1)
# 创建线性回归对象
lin_reg = LinearRegression()
# 训练数据,生成模型
lin_reg.fit(x, y)
print("the best compare analyse result:\n{}{}".format(lin_reg.intercept_, lin_reg.coef_))
# 预测
x_new = np.array([[0], [2]])
y_predict = lin_reg.predict(x_new)
print("the predict result is:\n{}".format(y_predict))
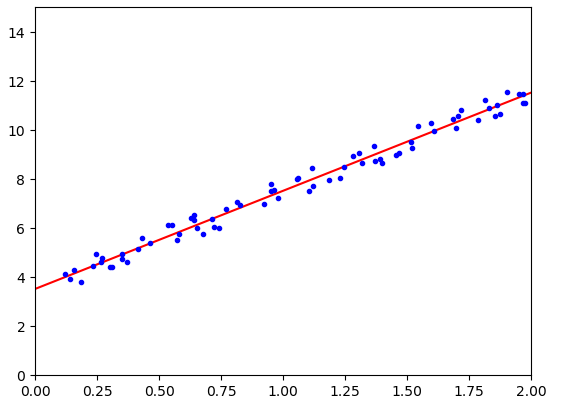
# 可视化展示
plt.plot(x_new, y_predict, "r-") # 预测的线性回归直线
plt.plot(x, y, "b.") # 生成的数据打点
plt.axis([0, 2, 0, 15]) # x,y轴设定,x:0~2,y:0~15
plt.show() # 显示
结果:

可视化: