数据和代码
http://pan.baidu.com/s/1dENAUTr
代码
"""
Created on July 9, 2018
@author : Li Guojing
"""
import pandas as pd
import matplotlib.pyplot as plt
import numpy as np
from sklearn.linear_model import LogisticRegression
#获得训练文件中的数据
df_train = pd.read_csv('Datasets/Breast-Cancer/breast-cancer-train.csv')
#读取测试文件
df_test= pd.read_csv('Datasets/Breast-Cancer/breast-cancer-test.csv')
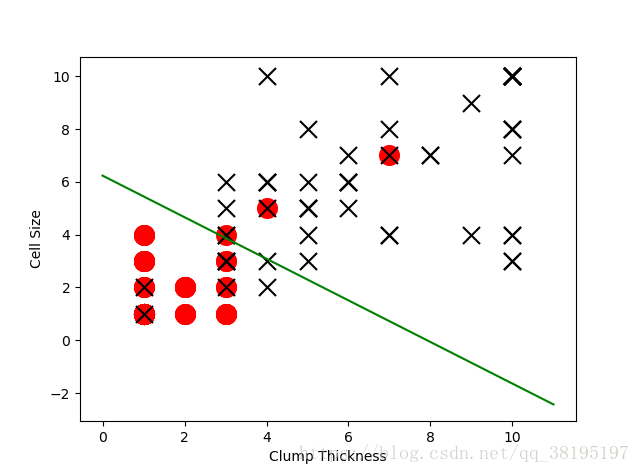
#选取'Clump Thickness'与'Cell Size'作为特征,构建测试集中的正负分类样本。
df_test_negative=df_test.loc[df_test['Type'] == 0][['Clump Thickness', 'Cell Size']]
df_test_positive=df_test.loc[df_test['Type'] == 1][['Clump Thickness', 'Cell Size']]
#绘制良性肿瘤样本点,标记为红色的o。
plt.scatter(df_test_negative['Clump Thickness'], df_test_negative['Cell Size'], marker='o', s=200, c='red')
#绘制恶性肿瘤样本点,标记为黑色的x。
plt.scatter(df_test_positive['Clump Thickness'], df_test_positive['Cell Size'], marker='x', s=150, c='black')
plt.xlabel('Clump Thickness')
plt.ylabel('Cell Size')
# #利用numpy中的random函数随机采样支线的截距和系数
# intercept = np.random.random([1])#返回一个[0, 1.0)的浮点数
# coef = np.random.random([2])#返回两个[0, 1.0)的浮点数
lx = np.arange(0, 12)
# ly = (- intercept - lx * coef[0])/coef[1]
# #绘制一条随机直线。
# plt.plot(lx, ly, c='yellow')
# plt.show()
#使用sklearn中的逻辑斯蒂回归分类器。
lr = LogisticRegression()
#使用训练样本学习直线的系数和截距。
lr.fit(df_train[['Clump Thickness', 'Cell Size']], df_train['Type'])
print('Testing accuracy:', lr.score(df_test[['Clump Thickness', 'Cell Size']], df_test['Type']))
intercept = lr.intercept_
coef = lr.coef_[0, :]
#原本这个分类面应该是lx * coef[0] + ly * coef[1] + intercept = 0,映射到2二维平面上之后应该是
ly = (-intercept - lx * coef[0]) / coef[1]
plt.plot(lx, ly, c='green')
plt.show()分类结果
Testing accuracy: 0.9371428571428572