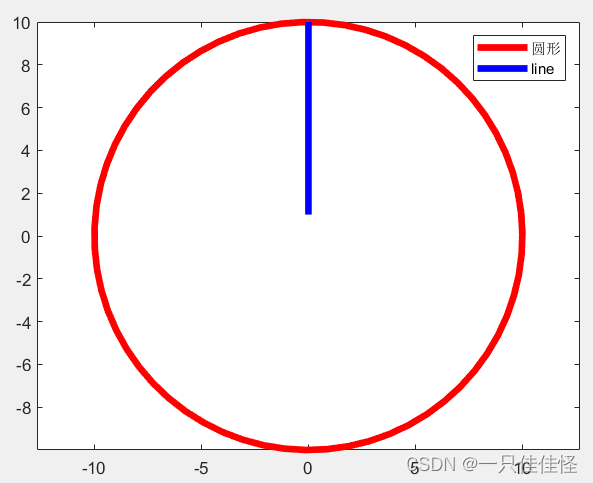
一、图例默认位置
默认的位置在NorthEast
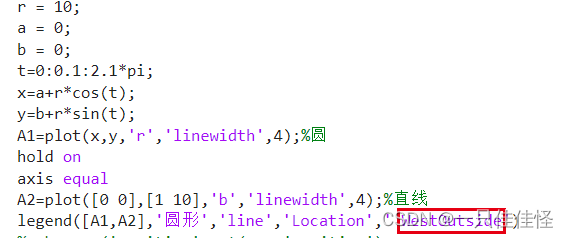
r = 10;
a = 0;
b = 0;
t=0:0.1:2.1*pi;
x=a+r*cos(t);
y=b+r*sin(t);
A1=plot(x,y,'r','linewidth',4);%圆
hold on
axis equal
A2=plot([0 0],[1 10],'b','linewidth',4);%直线
legend([A1,A2],'圆形','line')
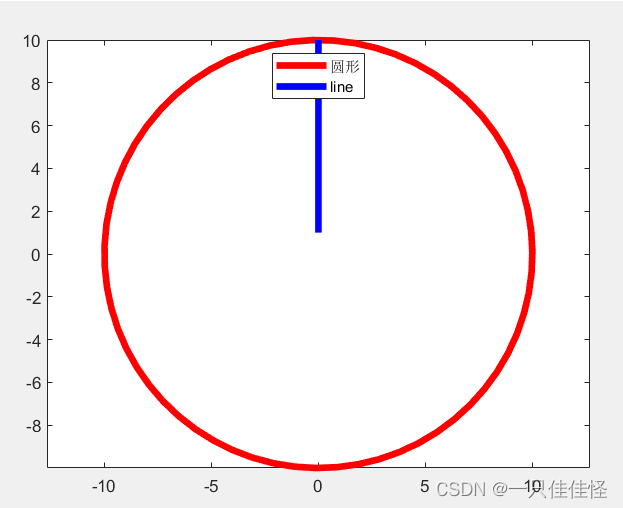
二、通过Location对legend的位置进行改变
变为North
r = 10;
a = 0;
b = 0;
t=0:0.1:2.1*pi;
x=a+r*cos(t);
y=b+r*sin(t);
A1=plot(x,y,'r','linewidth',4);%圆
hold on
axis equal
A2=plot([0 0],[1 10],'b','linewidth',4);%直线
legend([A1,A2],'圆形','line','Location','North')
三、图例放在图的其他位置
| 设置 | 位置 |
|---|---|
| North | inside plot box near top |
| South | inside bottom |
| East inside right | |
| West | inside left |
| NorthEast | inside top right (default for 2-D plots) |
| NorthWest | inside top left |
| SouthEast | inside bottom right |
| SouthWest’ | inside bottom left |
| NorthOutside | outside plot box near top |
| SouthOutside | outside bottom |
| EastOutside | outside right |
| WestOutside | outside left |
| NorthEastOutside | outside top right (default for 3-D plots) |
| NorthWestOutside | outside top left |
| SouthEastOutside | outside bottom right |
| SouthWestOutside | outside bottom left |
| Best | least conflict with data in plot |
| BestOutside | least unused space outside plot |
直接替换即可
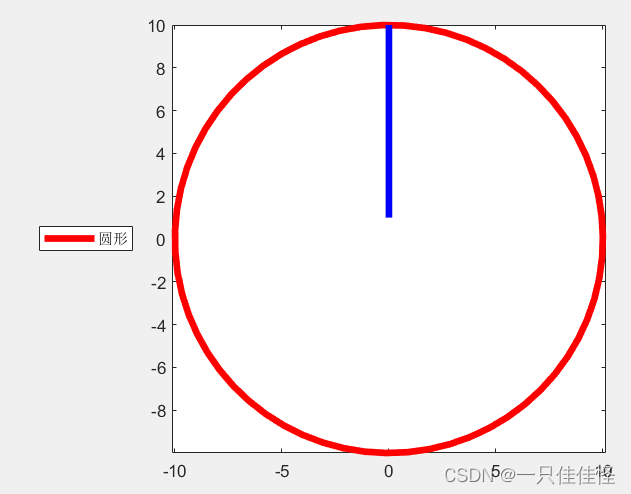
四、图例放在图的外面
r = 10;
a = 0;
b = 0;
t=0:0.1:2.1*pi;
x=a+r*cos(t);
y=b+r*sin(t);
A1=plot(x,y,'r','linewidth',4);%圆
hold on
axis equal
A2=plot([0 0],[1 10],'b','linewidth',4);%直线
legend([A1,A2],'圆形','line','Location',' WestOutside')

五、只显示一个曲线
r = 10;
a = 0;
b = 0;
t=0:0.1:2.1*pi;
x=a+r*cos(t);
y=b+r*sin(t);
A1=plot(x,y,'r','linewidth',4);%圆
hold on
axis equal
A2=plot([0 0],[1 10],'b','linewidth',4);%直线
legend([A1],'圆形','Location',' WestOutside')