import numpy as np
import matplotlib.pyplot as plt
#解决能显示中文
plt.rcParams['font.sans-serif']=['SimHei'] #指定默认字体 SimHei为黑体
plt.rcParams['axes.unicode_minus']=False #用来正常显示负号
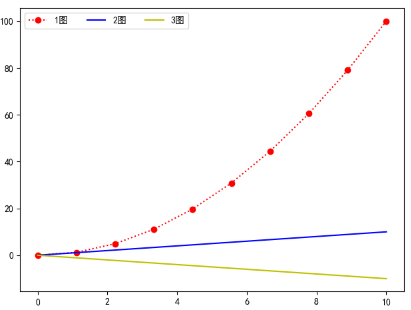
x=np.linspace(0,10,10)
y=x**2
fig=plt.figure()
ax=fig.add_subplot(1,1,1)
ax.plot(x,y,linestyle=':',marker='o',color='r',label='1图')
ax.plot(x,x,color='b',label='2图')
ax.plot(x,-x,color='y',label='3图')
ax.legend(loc=0,ncol=3) #画出图例
# loc: 表示位置,包括'upper right','upper left','lower right','lower left'等
# bbox_to_anchor: 表示legend距离图形之间的距离,当出现图形与legend重叠时,可使用bbox_to_anchor进行调整legend的位置
# 由两个参数决定,第一个参数为legend距离左边的距离,第二个参数为距离下面的距离
#'upper right'=1;'upper left'=2;'lower left'=3;'lower right'=4; 0 自适应找位置
#ncol 图例的列数
plt.show()