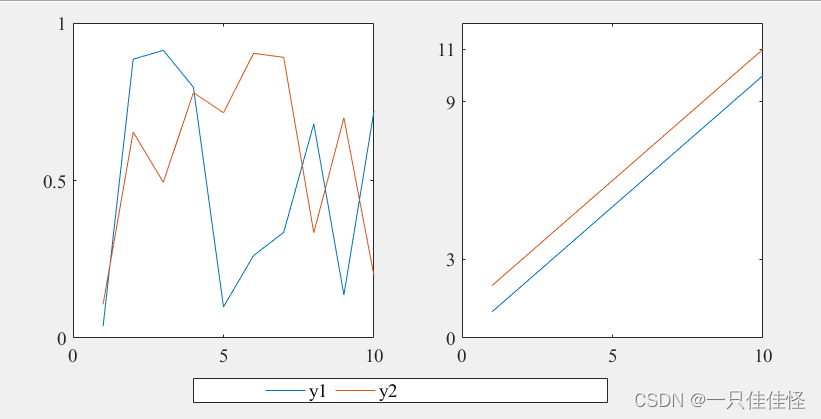
y1 = rand(10,2);
y2 = repmat(1:10,2,1)';
y2(:,2) = y2(:,1) + 1 ;
subplot(1,2,1,'position',[0.13  0.2 0.34  0.75]);
h{1} = plot(y1);
yticks([0 0.5 1])
xticks([0 5 10])
 set(gca,'FontName','Times New Roman','FontSize',14);
subplot(1,2,2,'position',[0.57  0.2 0.34 0.75]);
h{2} = plot(y2);
yticks([0 3 9 11])
xticks([0 5 10])
set(gca,'FontName','Times New Roman','FontSize',14);
hh = legend([h{1};h{2}],'y1','y2','Orientation','horizontal', 'location',[0.13,0.05,0.74,0.05],'FontName','Times New Roman','FontSize',14);