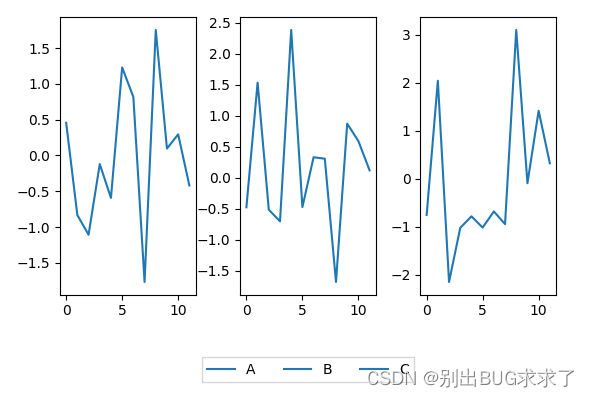
import matplotlib.pyplot as plt
import numpy as np

data1,data2,data3 = np.random.randn(3,12)

fig, ax = plt.subplots(ncols=3)
l1, = ax[0].plot(data1)
l2, = ax[1].plot(data2)
l3, = ax[2].plot(data3)

fig.subplots_adjust(bottom=0.3, wspace=0.33)

ax[1].legend(handles = [l1,l2,l3] , labels=['A', 'B', 'C'],loc='upper center',
             bbox_to_anchor=(0.5, -0.2),fancybox=False, shadow=False, ncol=3)
plt.show()