Vesuvius Challenge: Ink Detection tutorial维苏威挑战:墨水检测教程
目录
1.查看一下图像
初始化一些变量,查看片段照片。但它很有用。这是一张红外照片,因为墨水在红外光中更容易看到。
import torch
import torch.nn as nn
import torch.optim as optim
import numpy as np
import glob
import PIL.Image as Image
import torch.utils.data as data
import matplotlib.pyplot as plt
import matplotlib.patches as patches
from tqdm import tqdm
from ipywidgets import interact, fixed

PREFIX = '/kaggle/input/vesuvius-challenge/train/1/'
BUFFER = 30  # Buffer size in x and y direction 表示在 x 和 y 方向上的缓存区大小为 30
Z_START = 27 # First slice in the z direction to use 表示在 z 方向上第一个用到的切片数量,从第 27 个切片开始
Z_DIM = 10   # Number of slices in the z direction 表示在 z 方向上需要用到的切片数量,即选取 10 个切片进行处理
TRAINING_STEPS = 30000 #迭代次数
LEARNING_RATE = 0.03 #初始学习率
BATCH_SIZE = 32 #batchsize
DEVICE = torch.device("cuda" if torch.cuda.is_available() else "cpu")

plt.imshow(Image.open(PREFIX+"ir.png"), cmap="gray")

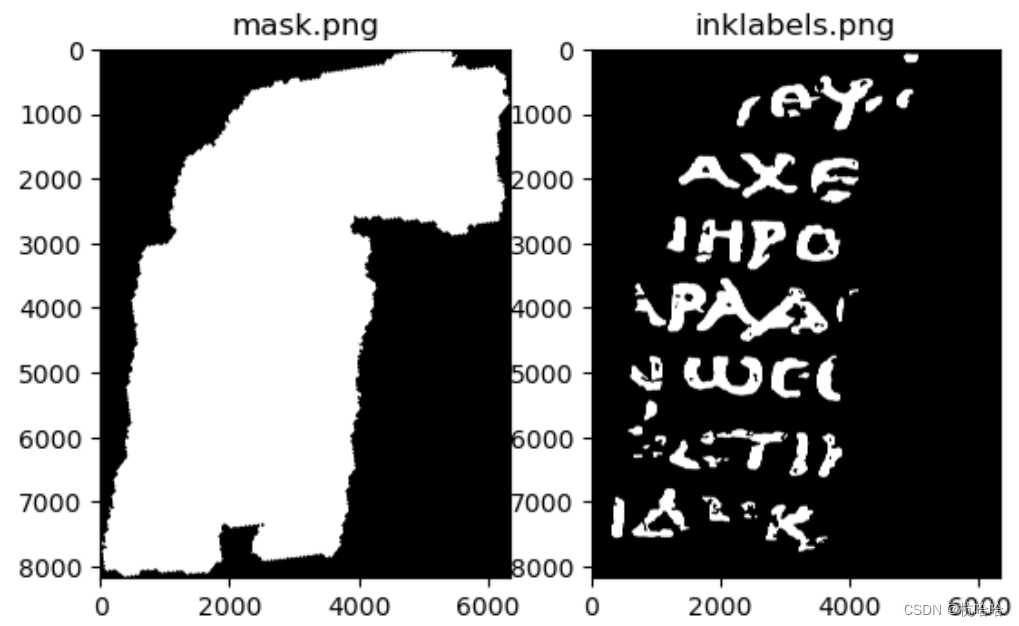
2.加载标签和掩膜:
mask.png: 包含数据的像素以及应该忽略哪些像素的掩模。
inklabels.png:我们的标签数据:像素是否含有墨水(这是根据红外照片手工标记的)。
mask = np.array(Image.open(PREFIX+"mask.png").convert('1'))
label = torch.from_numpy(np.array(Image.open(PREFIX+"inklabels.png"))).gt(0).float().to(DEVICE)
fig, (ax1, ax2) = plt.subplots(1, 2)
ax1.set_title("mask.png")
ax1.imshow(mask, cmap='gray')
ax2.set_title("inklabels.png")
ax2.imshow(label.cpu(), cmap='gray')
plt.show()
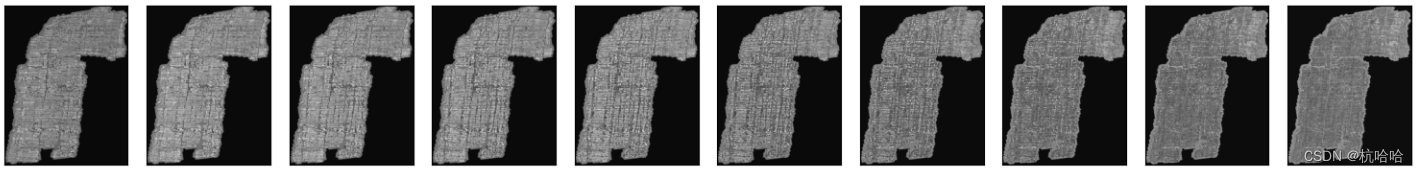
3.加载纸草片的 3D X 射线扫描图像
这个图像是表示为.tif 图像堆栈的。图像堆栈是一系列的16位灰度图像数组,每个图像代表沿着z轴的一个“切片”,从纸草下面到上面。我们将把它转换为一个4D张量,数据类型为32位浮点数,并将像素值转换为范围 [0, 1]。
为了节省内存,只会加载内部的一些切片(Z_DIM 切片)。查看图像。
images = [np.array(Image.open(filename), dtype=np.float32)/65535.0 for filename in tqdm(sorted(glob.glob(PREFIX+"surface_volume/*.tif"))[Z_START:Z_START+Z_DIM])]
image_stack = torch.stack([torch.from_numpy(image) for image in images], dim=0).to(DEVICE)

fig, axes = plt.subplots(1, len(images), figsize=(15, 3))
for image, ax in zip(images, axes):
  ax.imshow(np.array(Image.fromarray(image).resize((image.shape[1]//20, image.shape[0]//20)), dtype=np.float32), cmap='gray')
  ax.set_xticks([]); ax.set_yticks([])
fig.tight_layout()
plt.show()
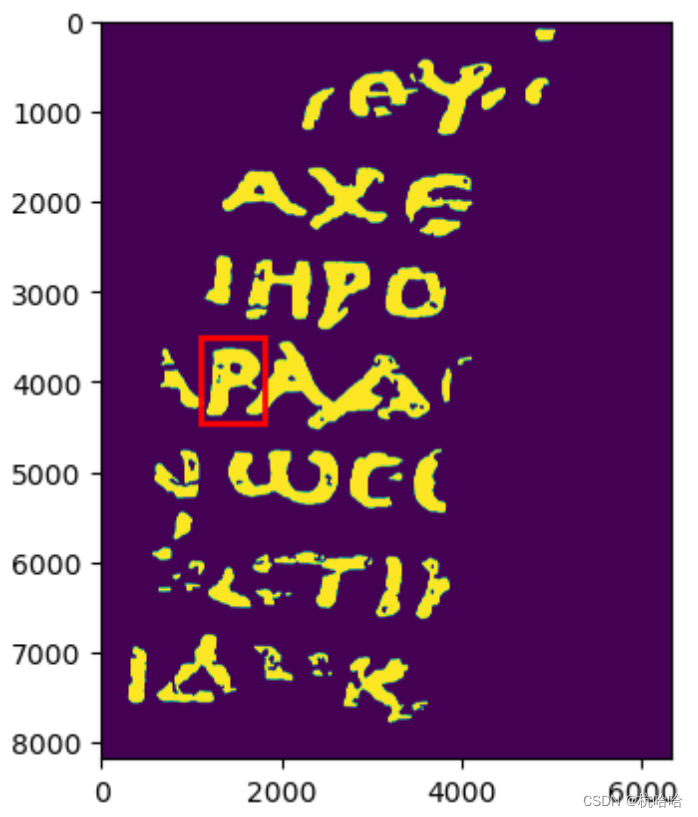
4创建一个子体数据集
使用字母“P”周围的一个小矩形进行评估,并将这些像素从训练集中排除。(实际上,那是一个希腊字母“rho”,看起来类似于我们的“P”。)
rect = (1100, 3500, 700, 950)
fig, ax = plt.subplots()
ax.imshow(label.cpu())
patch = patches.Rectangle((rect[0], rect[1]), rect[2], rect[3], linewidth=2, edgecolor='r', facecolor='none')
ax.add_patch(patch)
plt.show()
5.定义一个 PyTorch 数据集和一个简单的模型并进行训练。
class SubvolumeDataset(data.Dataset):
    def __init__(self, image_stack, label, pixels):
        self.image_stack = image_stack
        self.label = label
        self.pixels = pixels
    def __len__(self):
        return len(self.pixels)
    def __getitem__(self, index):
        y, x = self.pixels[index]
        subvolume = self.image_stack[:, y-BUFFER:y+BUFFER+1, x-BUFFER:x+BUFFER+1].view(1, Z_DIM, BUFFER*2+1, BUFFER*2+1)
        inklabel = self.label[y, x].view(1)
        return subvolume, inklabel

model = nn.Sequential(
    nn.Conv3d(1, 16, 3, 1, 1), nn.MaxPool3d(2, 2),
    nn.Conv3d(16, 32, 3, 1, 1), nn.MaxPool3d(2, 2),
    nn.Conv3d(32, 64, 3, 1, 1), nn.MaxPool3d(2, 2),
    nn.Flatten(start_dim=1),
    nn.LazyLinear(128), nn.ReLU(),
    nn.LazyLinear(1), nn.Sigmoid()
).to(DEVICE)
print("Generating pixel lists...")
# Split our dataset into train and val. The pixels inside the rect are the
# val set, and the pixels outside the rect are the train set.
# Adapted from https://www.kaggle.com/code/jamesdavey/100x-faster-pixel-coordinate-generator-1s-runtime
# Create a Boolean array of the same shape as the bitmask, initially all True
not_border = np.zeros(mask.shape, dtype=bool)
not_border[BUFFER:mask.shape[0]-BUFFER, BUFFER:mask.shape[1]-BUFFER] = True
arr_mask = np.array(mask) * not_border
inside_rect = np.zeros(mask.shape, dtype=bool) * arr_mask
# Sets all indexes with inside_rect array to True
inside_rect[rect[1]:rect[1]+rect[3]+1, rect[0]:rect[0]+rect[2]+1] = True
# Set the pixels within the inside_rect to False
outside_rect = np.ones(mask.shape, dtype=bool) * arr_mask
outside_rect[rect[1]:rect[1]+rect[3]+1, rect[0]:rect[0]+rect[2]+1] = False
pixels_inside_rect = np.argwhere(inside_rect)
pixels_outside_rect = np.argwhere(outside_rect)

print("Training...")
train_dataset = SubvolumeDataset(image_stack, label, pixels_outside_rect)
train_loader = data.DataLoader(train_dataset, batch_size=BATCH_SIZE, shuffle=True)
criterion = nn.BCELoss()
optimizer = optim.SGD(model.parameters(), lr=LEARNING_RATE)
scheduler = torch.optim.lr_scheduler.OneCycleLR(optimizer, max_lr=LEARNING_RATE, total_steps=TRAINING_STEPS)
model.train()
# running_loss = 0.0
for i, (subvolumes, inklabels) in tqdm(enumerate(train_loader), total=TRAINING_STEPS):
    if i >= TRAINING_STEPS:
        break
    optimizer.zero_grad()
    outputs = model(subvolumes.to(DEVICE))
    loss = criterion(outputs, inklabels.to(DEVICE))
    loss.backward()
    optimizer.step()
    scheduler.step()
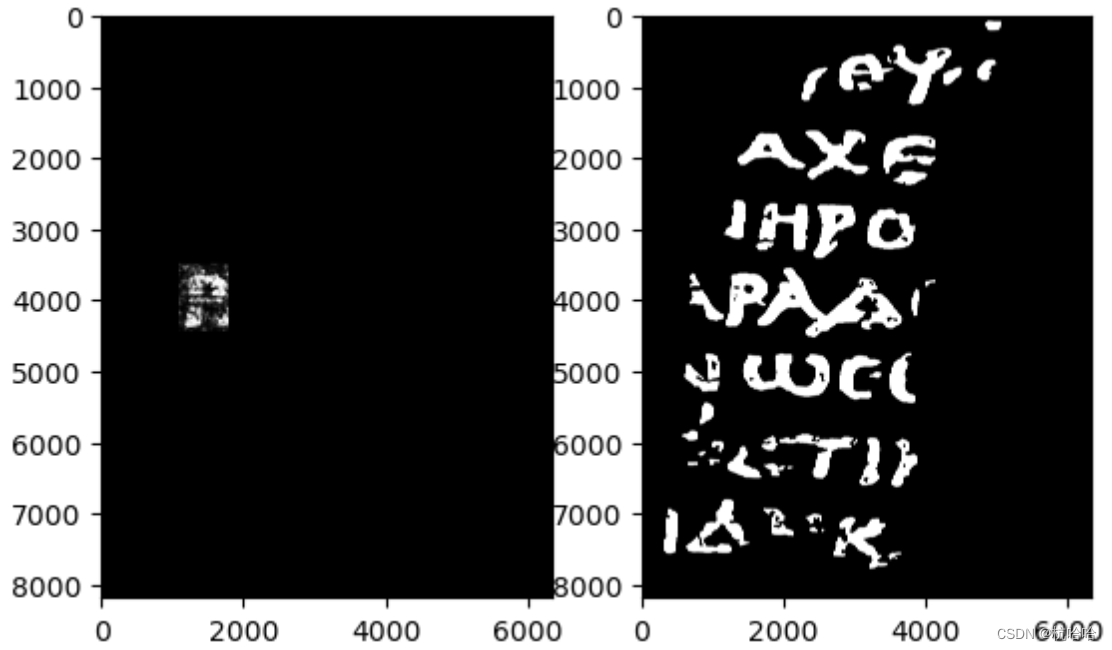
6.简单的验证一下
eval_dataset = SubvolumeDataset(image_stack, label, pixels_inside_rect)
eval_loader = data.DataLoader(eval_dataset, batch_size=BATCH_SIZE, shuffle=False)
output = torch.zeros_like(label).float()
model.eval()
with torch.no_grad():
    for i, (subvolumes, _) in enumerate(tqdm(eval_loader)):
        for j, value in enumerate(model(subvolumes.to(DEVICE))):
            output[tuple(pixels_inside_rect[i*BATCH_SIZE+j])] = value

fig, (ax1, ax2) = plt.subplots(1, 2)
ax1.imshow(output.cpu(), cmap='gray')
ax2.imshow(label.cpu(), cmap='gray')
plt.show()
7.选择一个阈值,0.4的置信度。
THRESHOLD = 0.4
fig, (ax1, ax2) = plt.subplots(1, 2)
ax1.imshow(output.gt(THRESHOLD).cpu(), cmap='gray')
ax2.imshow(label.cpu(), cmap='gray')
plt.show()
8.输出一个csv文件
最后,Kaggle需要一个运行长度编码的submission.csv文件,输出它。
# Adapted from https://www.kaggle.com/code/stainsby/fast-tested-rle/notebook
# and https://www.kaggle.com/code/kotaiizuka/faster-rle/notebook
def rle(output):
    pixels = np.where(output.flatten().cpu() > THRESHOLD, 1, 0).astype(np.uint8)
    pixels[0] = 0
    pixels[-1] = 0
    runs = np.where(pixels[1:] != pixels[:-1])[0] + 2
    runs[1::2] = runs[1::2] - runs[:-1:2]
    return ' '.join(str(x) for x in runs)
rle_output = rle(output)
# This doesn't make too much sense, but let's just output in the required format
# so notebook works as a submission. :-)
print("Id,Predicted\na," + rle_output + "\nb," + rle_output, file=open('submission.csv', 'w'))