该例子通过模拟一些随机数,完成简单的数理统计工作,作为后期数据分析的一次体验
随机漫步:随机产生1或-1随机数,模仿一个人前进或者后退
在此环境下,进行一些统计工作
随机漫步
- 首页做一些准备工作
import numpy as np                  # 导入随机数库

# 漫步次数
num = 1000- 产生所需要的一些随机数
# 产生n次漫步的情况,此时数据为0或者1
draws = np.random.randint(0, 2, size=num)
# 将数据为0的部分替换为-1
steps = np.where(draws>0, 1, -1)
# 通过累加实现足迹的记录
walk = steps.cumsum()
# 输出足迹记录
print('足迹:{}'.format(walk))
'''
[-1  0  1  0  1  2  1  0 -1  0 -1  0 -1  0 -1 -2 -1 -2 -1  0  1  2  3  2
  1  0  1  2  1  0 ... 67 68 67 68 67 68]
'''- 统计前进和后退的最远距离
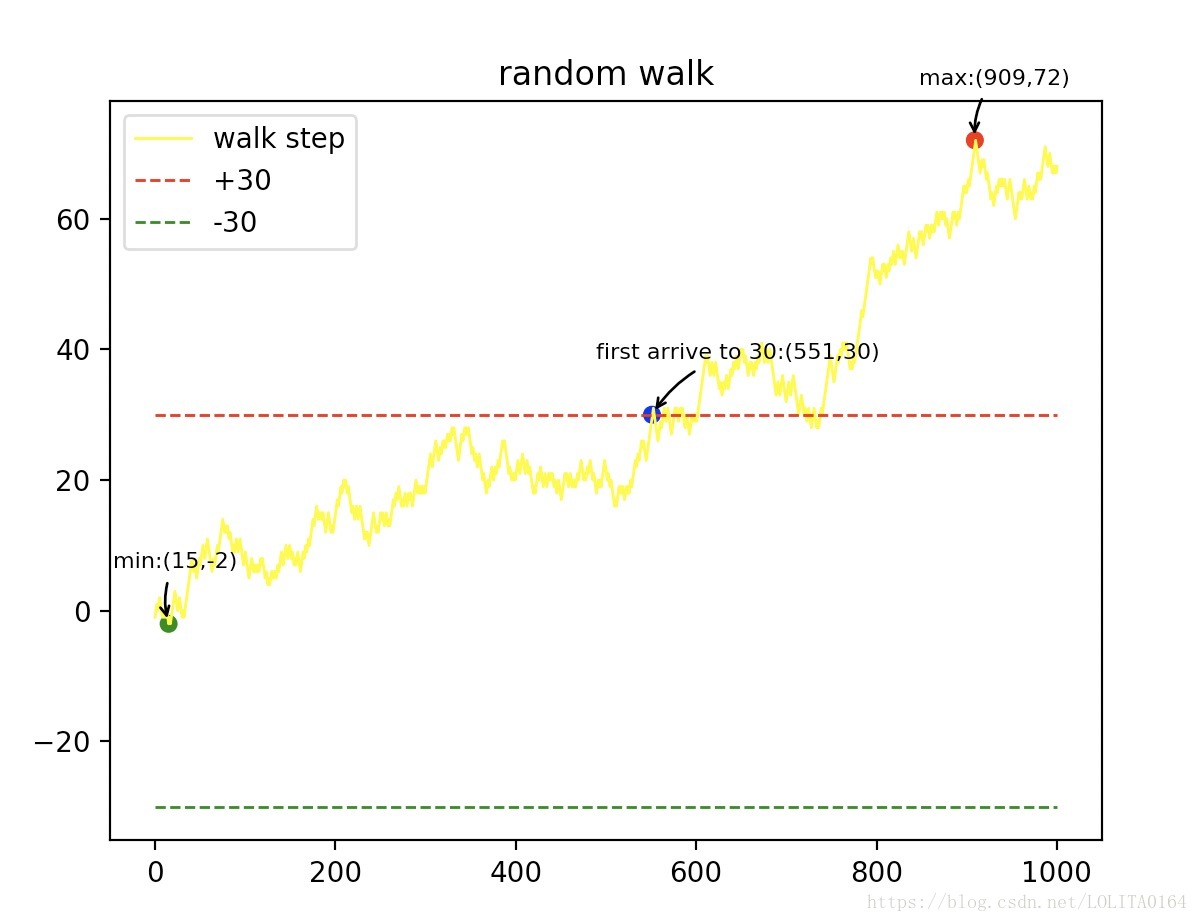
# 统计漫步过程中,前进和后退最大的距离
max_y = walk.max()
max_x = walk.argmax()
print('在{}次漫步中,第{}步前进最远的距离:{}'.format(num,max_x,max_y))
'''在1000次漫步中,第909步前进最远的距离:72'''
min_y = walk.min()
min_x = walk.argmin()
print('在{}次漫步中,第{}步后退最远的距离:{}'.format(num,min_x,min_y))
'''在1000次漫步中,第15步后退最远的距离:-2'''- 统计满足一定条件的数据
# 统计漫步过程中,距离原点为30的索引
greater_or_equal_30 = np.abs(walk)>=30
print('在{}次漫步中,距离超过30的总数为:{}'.format(num,greater_or_equal_30.sum()))
'''在1000次漫步中,距离超过30的总数为:413'''
# 首次到达30的索引
first_30 = greater_or_equal_30.argmax()
print('在{}次漫步中,首次距离超过30的索引:{}'.format(num,first_30))
'''在1000次漫步中,首次距离超过30的索引:551'''
value = np.where(greater_or_equal_30==True)
print('在1000次漫步中,距离超过30的索引:{}'.format(value))
'''
在1000次漫步中,距离超过30的索引:(array([551, 552, 553, 563, 564, 565, 567, 568, 569, 575, 576, 577, 578,... 970, 971, 972, 973, 974, 975, 976, 977, 978, 979, 980, 981, 982, 983, 984, 985, 986, 987, 988, 989,990, 991, 992, 993, 994, 995, 996, 997, 998, 999]),)
'''
如果上述数据太过难看,我们可以使用 matplotlib 来绘制图形,让数据更直观
- 首先导入库,没有库请安装
python2:
pip install matplotlibpython3:
pip3 install matplotlib绘制图形
# 导入
import matplotlib.pyplot as plt     # 绘图库
# 绘制相关图形
x = np.linspace(0, 1000, num=1000)
y1 = walk
plt.figure()
plt.title('random walk')
# 绘制出漫步的足迹
plt.plot(x, y1, color='yellow', linewidth=1, label='walk step')
y2 = np.ones(1000)*30
y3 = -y2
# 绘制+-30线
plt.plot(x, y2, color='r', linewidth=1, linestyle='--', label='+30')
plt.plot(x, y3, color='g', linewidth=1, linestyle='--', label='-30')
# 绘制关键点
plt.scatter([max_x,min_x,first_30], [max_y,min_y,walk[first_30]], s=30, color=['r','g','b'])
# 添加标注
# 最大距离坐标
plt.annotate(
    'max:({},{})'.format(max_x,max_y),
    xy = (max_x,max_y),
    xycoords = 'data',
    xytext = (-20, +20),
    textcoords='offset points',
    fontsize = 8,
    arrowprops=dict(arrowstyle='->', connectionstyle="arc3,rad=.2")
)
# 最小距离坐标
plt.annotate(
    'min:({},{})'.format(min_x,min_y),
    xy = (min_x,min_y),
    xycoords = 'data',
    xytext = (-20, +20),
    textcoords='offset points',
    fontsize = 8,
    arrowprops=dict(arrowstyle='->', connectionstyle="arc3,rad=.2")
)
# 首次到达30距离的坐标
if walk[first_30]==30:
    plt.annotate(
        'first arrive to 30:({},{})'.format(first_30, walk[first_30]),
        xy=(first_30, walk[first_30]),
        xycoords='data',
        xytext=(-20, +20),
        textcoords='offset points',
        fontsize=8,
        arrowprops=dict(arrowstyle='->', connectionstyle="arc3,rad=.2")
    )

# 图例
plt.legend(loc='best')
# 显示图像
plt.show()
多组随机漫步
# 模拟多个随机漫步,这里生成了15组随机数
nwalks = 15
nsteps = 1000
# 仅需要对参数size稍作修改
draws = np.random.randint(0, 2, size=(nwalks, nsteps))
steps = np.where(draws>0, 1, -1)
walks = steps.cumsum(axis=1) # 横向累加 - 统计相关数据
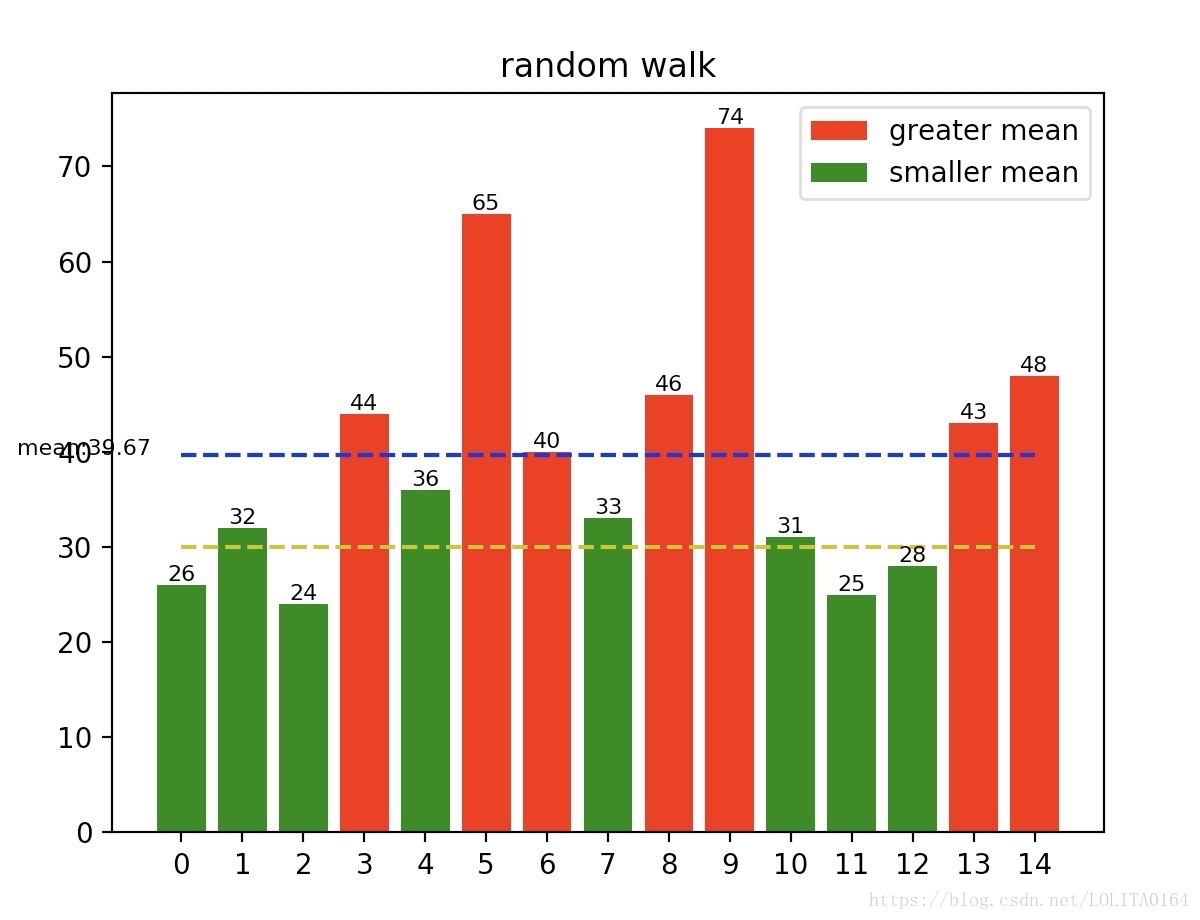
# 最远距离
max_distance = walks.max(axis=1)
print('{}组随机漫步中,距离最远为:{}'.format(nwalks,max_distance))

'''15组随机漫步中,距离最远为:[26 32 24 44 36 65 40 33 46 74 31 25 28 43 48]'''

# 距离原点超过30
values = np.abs(walks) >= 30
# 每组的随机漫步中,是否存在距离超过30
hits30 = np.any(values, axis=1)  # 横向查找
print('{}组随机漫步中,共有{}组存在距离超过30的,具体为:{}'.format(nwalks,hits30.sum(),hits30))

'''15组随机漫步中,共有11组存在距离超过30的,具体为:[False  True False  True  True  True  True  True  True  True  True False
 False  True  True]'''

# 在这些距离超过30的数组中,首次移动到30的索引
value = (np.abs(walks[hits30]) >= 30).argmax(axis=1)
value_mean = np.mean(value)
print('{}组随机漫步中,首次移动到30的索引为:{},平均需{}次移动'.format(nwalks,value,np.int(value_mean)))

'''15组随机漫步中,首次移动到30的索引为:[813 321 143 269 385 577 771 251 843 911 743],平均需547次移动'''- 绘制图形,统计最远距离的情况
# 均值
distance_mean = max_distance.mean()
# 大于均值
greater_mean = np.where(max_distance>distance_mean, max_distance, 0)
# 小于均值
smaller_mean = np.where(max_distance<=distance_mean, max_distance, 0)

plt.figure(num=2)
plt.title('random walk')
x = np.arange(nwalks)
# 绘制柱状图
l1 = plt.bar(x, greater_mean, color='r')
l2 = plt.bar(x, smaller_mean, color='g')
# 绘制数据
for x0, y0 in zip(x,max_distance):
    plt.text(x0, y0, '{}'.format(y0), ha='center', va='bottom', fontdict={'size': 8})
# 绘制均线
plt.plot(x, np.ones(nwalks)*distance_mean, color='b', linestyle='--')
# 绘制30线
plt.plot(x, np.ones(nwalks)*30, color='y', linestyle='--')
# 添加注释
plt.text(-0.5, distance_mean, 'mean:{:.2f}'.format(distance_mean), ha='right', fontdict={'size': 8})

# 设置图例
plt.legend(handles=[l1, l2], labels=['greater mean','smaller mean'], loc='best')
# 设置坐标轴刻度format
plt.xticks(x)
plt.show()
以上就是随机漫步的简单应用,关于更多数据分析,读者可以自由发挥;
如果想了解更多关于matplotlib库的使用,请关注后面更新。