数据随机漫步
三岁日常玩编程——随机漫步
安装 matplotlib第三方库
打开DOS命令模式
wind 键加 R 开启运行,输入 cmd 回车
在 cmd 中输入 pip install matplotlib 回车即可
如果安装不了或报错
到https://pypi.python.org/pypi/matplotlib/
下载对应版本后缀名为.whl
在dos中到文件所在文件夹然后输入python -m pip install --user matplotlib-1.4.3-cp35-none-win32.whl即可
构建随机漫步函数类
#random_walk.py
#创建一个随机漫步的类
from random import choice
#导入随机函数

class RandomWalk():
      '''生成一个随机漫步的类'''

      def __init__(self, num_points = 5000):
            '''初始化属性'''
            self.num_points = num_points
            #默认次数为5000

            #所有随机初始漫步源于(0,0)
            self.x_values = [0]
            self.y_values = [0]


      def fill_walk(self):
            '''计算随机漫步包含的点'''

            #不断漫步,直到列表达到指定长度
            while len(self.x_values) < self.num_points:

                  #决定前进方向及距离
                  x_direction = choice([1,-1])
                  x_distance = choice([0, 1, 2, 3, 4])
                  x_step = x_direction * x_distance

                  y_direction = choice([1,-1])
                  y_distance = choice([0, 1, 2, 3, 4])
                  y_step = y_direction * y_distance

                  #拒绝原地踏步
                  if x_step == 0 and y_step == 0 :
                        continue

                  #计算下一个点的位置
                  next_x = self.x_values[-1] + x_step
                  next_y = self.y_values[-1] + y_step

                  #把位置添加到列表
                  self.x_values.append(next_x)
                  self.y_values.append(next_y)
先初始化位置为(0, 0)然后分别设 x , y 的前进方式,1 或 -1代表右边或左边,长度为 0 到 4
假设 x ,y 在原地时不算,把结果放入列表
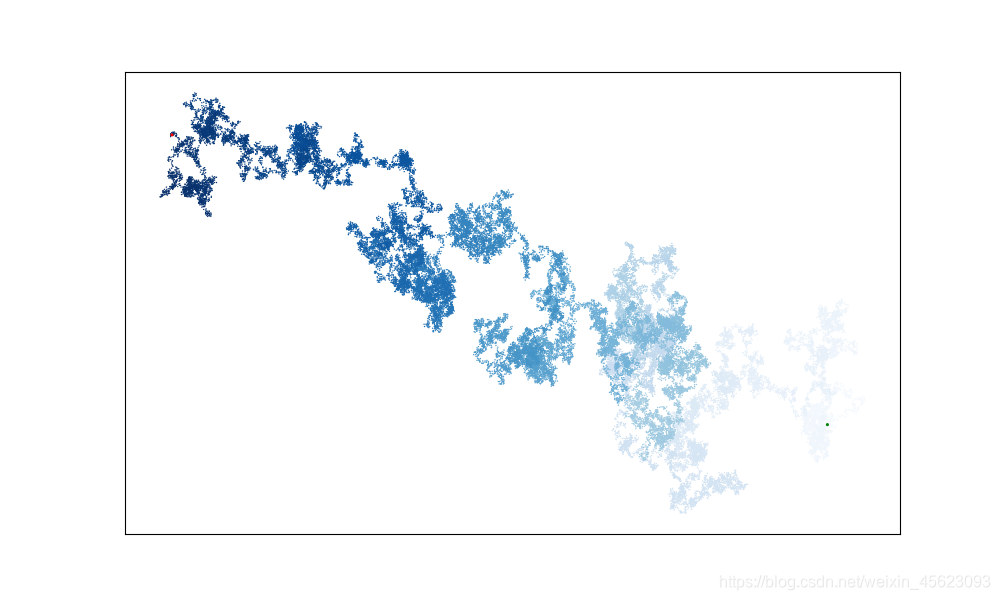
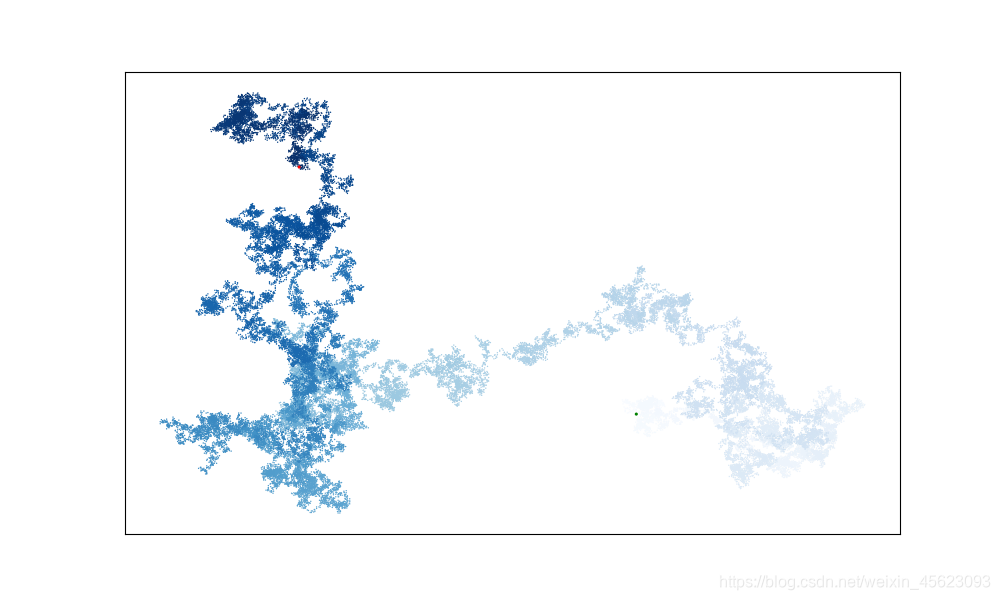
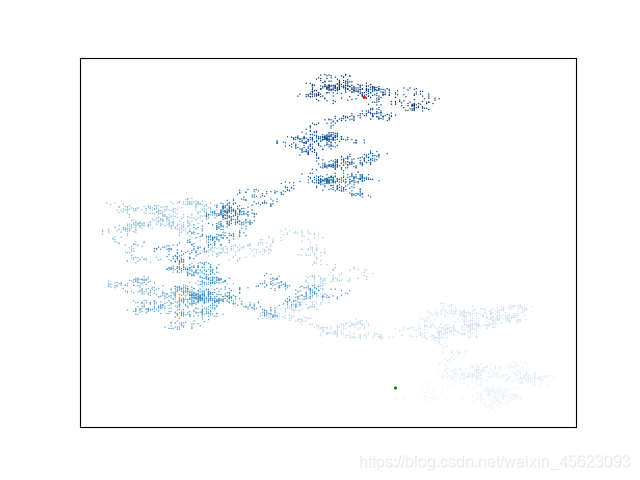
绘制随机漫步图
# rw_visual02.py
#导入第三方库及随机漫步类
import matplotlib.pyplot as plt
from random_walk import RandomWalk

#只要程序处于活动转态,就不断模拟随机漫步
while True:

      #创建一个RandomWalk实例,并将结果绘制出来
      rw = RandomWalk(50000)#括号中的次数为随机漫步次数
      rw.fill_walk()

      #设置绘图窗口尺寸
      plt.figure(figsize=(10, 6))

      '''创建列表长度从0到num_points'''
      point_numbers = list(range(rw.num_points))
      '''
      标出各个点的位置色彩重浅到深,每个点的大小为1.
      '''
      plt.scatter(rw.x_values, rw.y_values, c=point_numbers, cmap=plt.cm.Blues,
                  edgecolor='none', s = 1)
      #突出起点和终点
      plt.scatter(0, 0, c='green', edgecolors='none', s=5)
      plt.scatter(rw.x_values[-1],rw.y_values[-1], c='red', edgecolors='none',
                  s=5)
      #隐藏坐标轴
      plt.axes().get_xaxis().set_visible(False)
      plt.axes().get_yaxis().set_visible(False)


      plt.show()

      keep_running = input('是否继续(y/n):')
      if keep_running  == 'n':
            break
生成图每次都不一样,虽然无序但是也略有美感
成品展示


海星⑧
等什么抓紧试试吧,你也可以的!
觉得海星的话记得三连:点赞,留言,收藏
