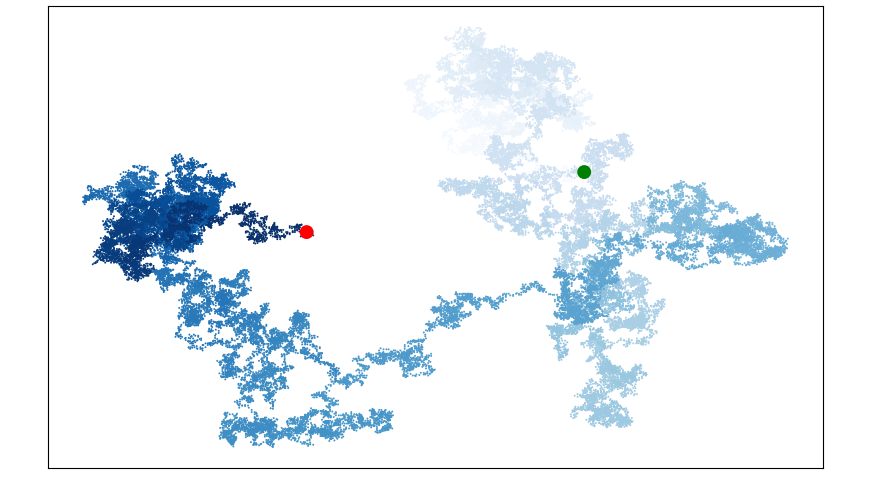
随机漫步就像在沙漠迷失方向的人,任何一步都是随机的方向不确定的。
下面的事例中展示了如何生成随机点并随机生成后面的点并在坐标轴上显示出来,并且用颜色的深浅来展示漫步的过程。
创建随机漫步类 random_walk.py
 1 # random_walk.py
 2 from random import choice
 3
 4 #定义一个随机漫步的类
 5 class RandomWalk():
 6     def __init__(self,num_points = 5000):
 7         self.num_points = num_points;
 8         #每次漫步都从(0,0)点出发
 9         self.x_values = [0]
10         self.y_values = [0]
11
12     # 选择方向
13     def fill_walk(self):
14         # 不断漫步,直到达到指定的长度
15         while len(self.x_values) < self.num_points:
16             #决定前进的方向以及前进的距离
17             x_direction = choice([1,-1])
18             x_distance = choice([0,1,2,3,4])
19             x_step = x_direction *x_distance
20
21             y_direction = choice([1,-1])
22             y_distance = choice([0,1,2,3,4])
23             y_step = y_direction*y_distance
24
25             #拒绝原地踏步
26             if x_step == 0 and y_step == 0:
27                 continue
28
29             #计算下一个点的x,y值
30             next_x = self.x_values[-1] + x_step
31             next_y = self.y_values[-1] + y_step
32
33             #将所有的点添加到列表中
34             self.x_values.append(next_x)
35             self.y_values.append(next_y)
随机漫步过程 rw_visual.py
 1 import matplotlib.pyplot as plt
 2 from random_walk import RandomWalk
 3
 4 #放在while循环中查看多次漫步
 5 while True:
 6     #创建漫步实例
 7     rw = RandomWalk(50000)
 8     #调用 fill_walk()函数获得漫步点
 9     rw.fill_walk()
10
11     # 设置绘图窗口的尺寸以适应屏幕,单位:英寸
12     plt.figure(figsize = (10,6))
13
14     #range()函数生成了一个数字列表,其中包含的数字个数与漫步包含的点数相同并保存下来
15     point_numbers = list(range(rw.num_points))
16
17     #将参数c设置为point_numbers,用来指定颜色映射,并指定颜色为蓝色。从浅蓝色到深蓝色的渐变(突出先后顺序)
18     #edgecolor = 'none' 表示删除每个点周围的轮廓
19     #s代表漫步点的尺寸
20     plt.scatter(rw.x_values,rw.y_values,c = point_numbers,cmap = plt.cm.Blues,edgecolor = 'none',s = 2)
21
22     # 突出起点和终点
23     plt.scatter(0,0,c = 'green',edgecolors = 'none',s = 100)
24     plt.scatter(rw.x_values[-1],rw.y_values[-1],c = 'red',edgecolor = 'none',s = 100)
25
26     # 隐藏坐标轴
27     plt.axes().get_xaxis().set_visible(False)
28     plt.axes().get_yaxis().set_visible(False)
29
30     plt.show()
31
32     keep_running = input("Make another walk?(y/n)")
33     if keep_running == 'n':
34         break
效果展示如下:
