高斯分布
1、定义
高斯分布也称正态分布,又名常态分布。若随机变量X服从一个均值为、均方差为的概率分布,且其概率密度函数为

则这个随机变量就称为正态随机变量,正态随机变量服从的分布就称为正态分布,记作
![]()
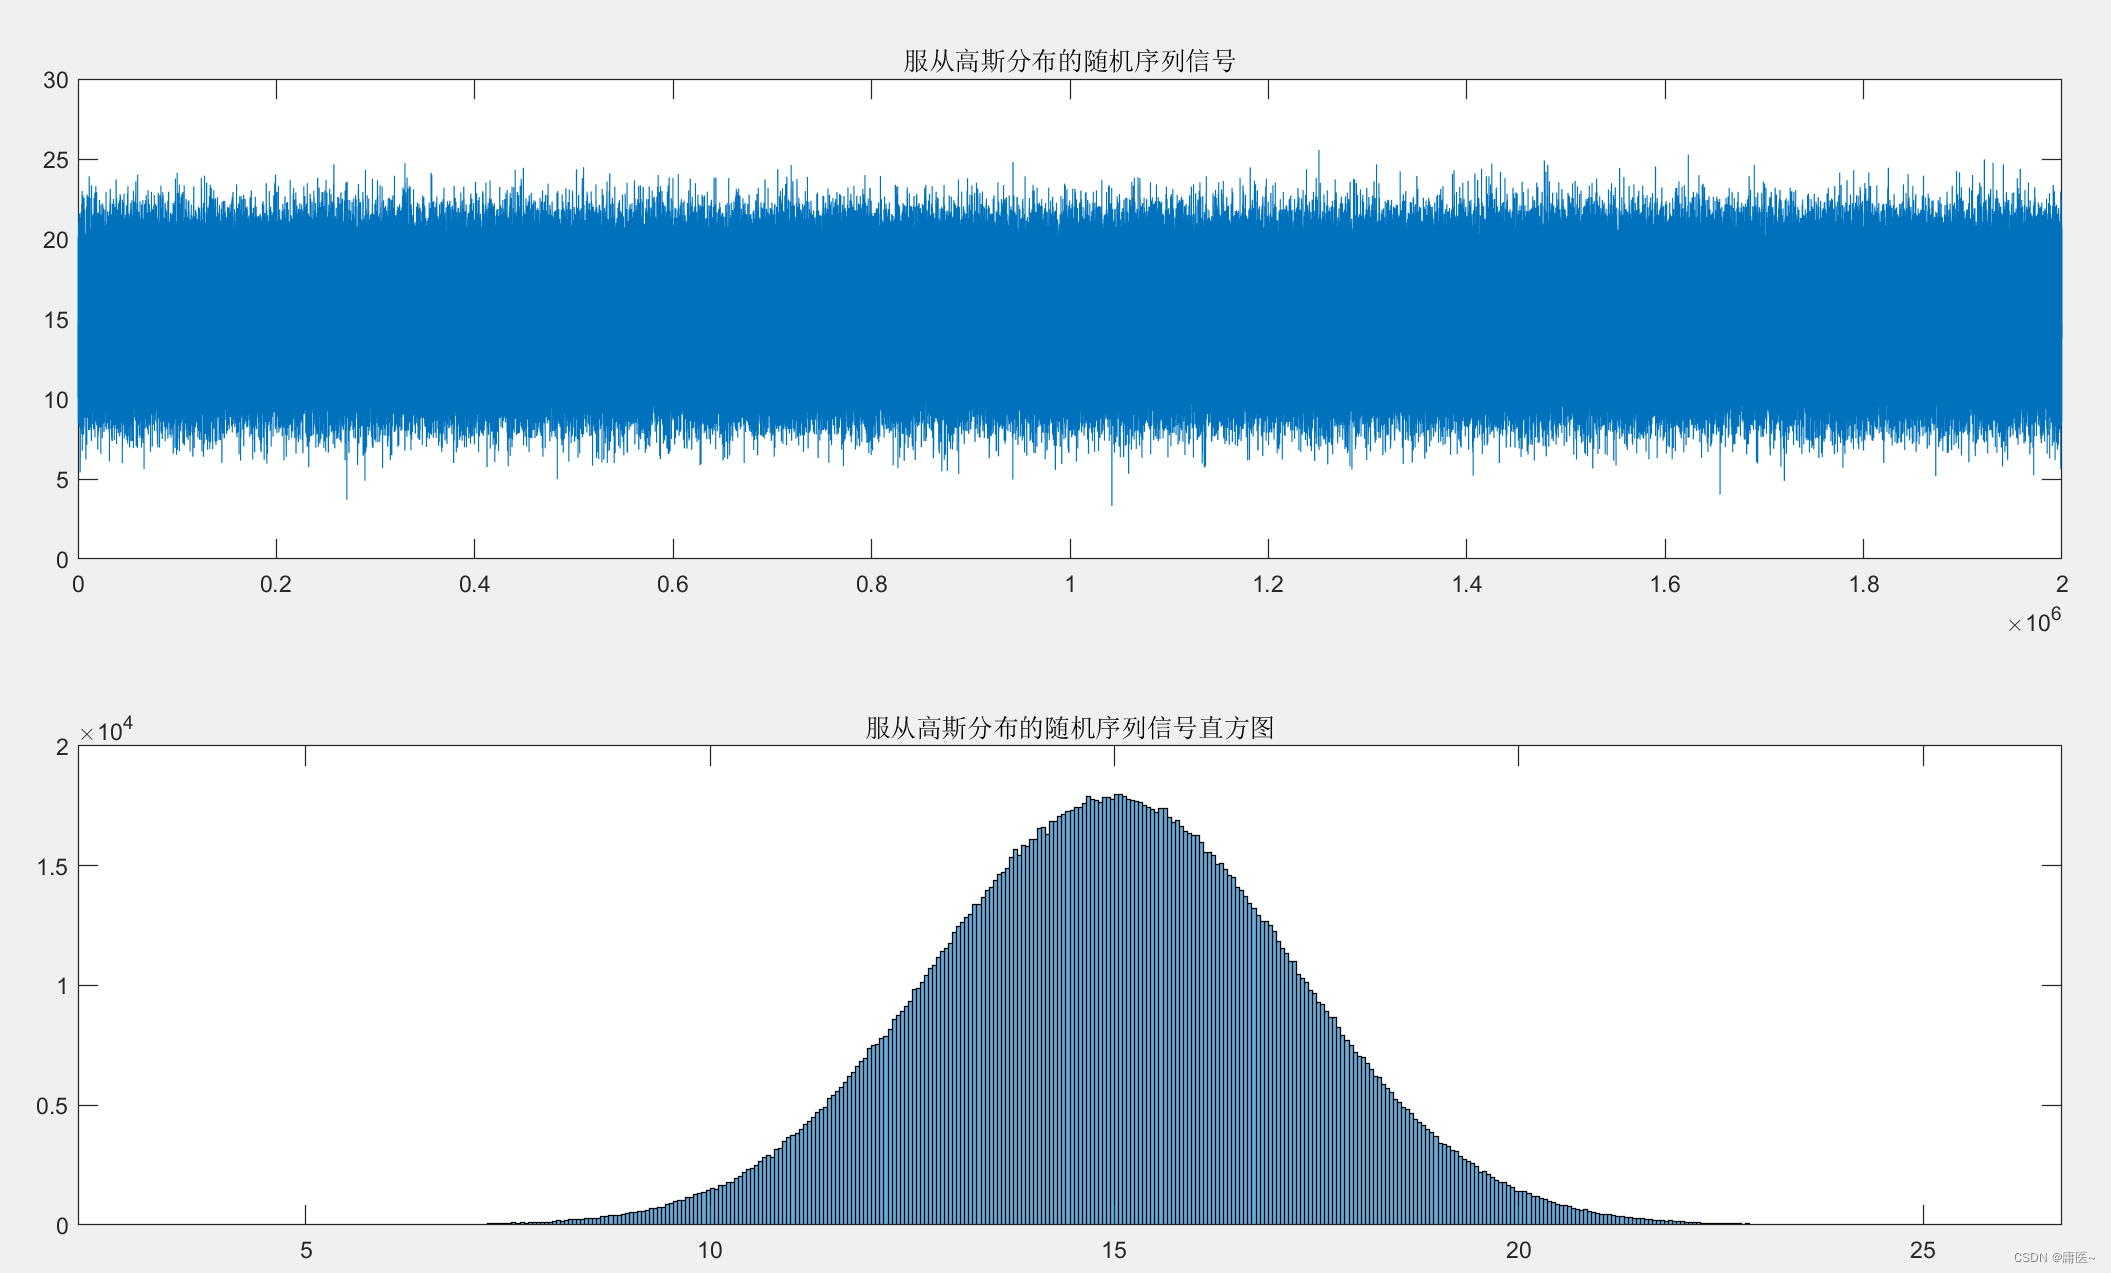
2、matlab仿真高斯分布
matlab中可以用randn生成满足标准正态分布的序列,对这一个标准正态分布的序列改变其方差和均值后就可以得到不同参数下的正态分布。

matlab代码:
clc
clear
close all

num_plot = 2 ;
data_mean =  [15, 2 ];
variance  =  [5, 25];

N= 2000000     ;

for i=1:num_plot
    y(i,:)=  sqrt(variance(i)) * randn(1,N) + data_mean(i);
end

figure
subplot(211);plot(y(1,:));
title('服从高斯分布的随机序列信号');
subplot(212);histogram(y(1,:));
title('服从高斯分布的随机序列信号直方图');


for i=1:num_plot
    [a(i,:),b(i,:)]=hist(y(i,:),50);
end

x1_lim = min(min(b));
x2_lim = max(max(b));

 figure
 for i=1:num_plot
    subplot(num_plot,1,i)
    plot(b(i,:),a(i,:)) ,xlim([x1_lim,x2_lim])
    title({['均值=',num2str(data_mean(i)),'方差=',num2str(variance(i))];'服从高斯分布的随机序列信号概率密度函数'});
 end
高斯分布还可由均匀序列通过Box_muller变换得到,可参考该文章
瑞利分布
1、定义
若随机变量x 满足
![]()
则称x服从瑞利分布,其期望和方差为:
![]()
分布函数为:

2、均匀分布仿真瑞利分布

瑞利分布概率密度函数图

matlab代码 :
% 均匀分得到瑞利分布

x2= rand(1,N) ;
y2= sqrt(-2*log(x2)) ;
[Occurance_2,x_2]=hist(y2,50);

figure
plot(x_2,Occurance_2,'b--o');
ylabel('Occurance');
xlabel('x');
legend('Rayleigh distribution');
3、高斯分布仿真瑞利分布

瑞利分布概率密度函数图

matlab代码 :
% 高斯分布仿真瑞利分布
N=500000;
x1_1 = randn(1,N) ;
x1_2 = randn(1,N) ;
y1   = sqrt(x1_1.^2+x1_2.^2) ;
[Occurance,x]=hist(y1,50);

figure
plot(x,Occurance,'b--o');
ylabel('Occurance');
xlabel('x');
legend('Rayleigh distribution');