统计检验的方法
这个老哥的代码,不同size用不同的方法都写清楚了
# -*- coding: utf-8 -*-
'''
Author:Toby
QQ:231469242,all right reversed,no commercial use

'''

import scipy
from scipy.stats import f
import numpy as np
import matplotlib.pyplot as plt
import scipy.stats as stats
# additional packages
from statsmodels.stats.diagnostic import lillifors

group1=[2,3,7,2,6]
group2=[10,8,7,5,10]
group3=[10,13,14,13,15]
list_groups=[group1,group2,group3]
list_total=group1+group2+group3


#正态分布测试
def check_normality(testData):
    #20<样本数<50用normal test算法检验正态分布性
    if 20<len(testData) <50:
       p_value= stats.normaltest(testData)[1]
       if p_value<0.05:
           print"use normaltest"
           print "data are not normal distributed"
           return  False
       else:
           print"use normaltest"
           print "data are normal distributed"
           return True

    #样本数小于50用Shapiro-Wilk算法检验正态分布性
    if len(testData) <50:
       p_value= stats.shapiro(testData)[1]
       if p_value<0.05:
           print "use shapiro:"
           print "data are not normal distributed"
           return  False
       else:
           print "use shapiro:"
           print "data are normal distributed"
           return True

    if 300>=len(testData) >=50:
       p_value= lillifors(testData)[1]
       if p_value<0.05:
           print "use lillifors:"
           print "data are not normal distributed"
           return  False
       else:
           print "use lillifors:"
           print "data are normal distributed"
           return True

    if len(testData) >300:
       p_value= stats.kstest(testData,'norm')[1]
       if p_value<0.05:
           print "use kstest:"
           print "data are not normal distributed"
           return  False
       else:
           print "use kstest:"
           print "data are normal distributed"
           return True


#对所有样本组进行正态性检验
def NormalTest(list_groups):
    for group in list_groups:
        #正态性检验
        status=check_normality(group1)
        if status==False :
            return False


#对所有样本组进行正态性检验
NormalTest(list_groups)
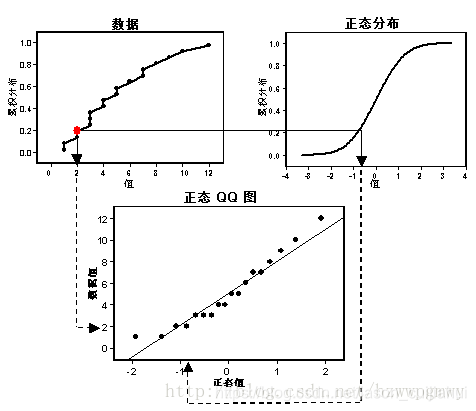
QQ图
原理:根据两个样本的累计分布函数,同分为点两者的不同取值,取点画图
与高斯分布
与高斯分布对比,如果右面是标准高斯分布,则样本点的分布成直线。若直线为y=kx+b,则左面服从均值为b,标准差为k的高斯分布。(注:下面的代码实现的QQ图好像内部标准化过)
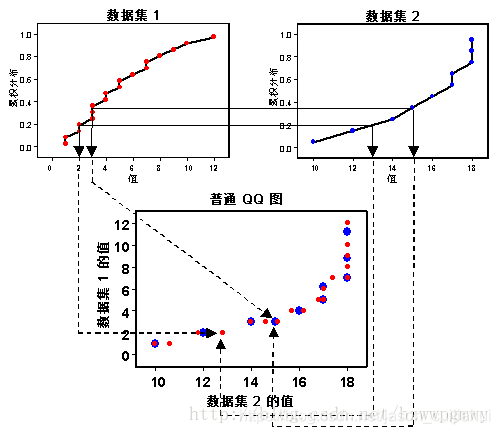
与另外一个样本对比
代码
import numpy as np
from scipy import stats
s = st.norm(mu, sigma).rvs(1000)
import pandas as pd
import matplotlib.pyplot as plt
import statsmodels.api as sm
from statsmodels.graphics.api import qqplot
# 生成高斯样本点
# 均值为mu,方差为sigma
mu, sigma = 100, 4
data = np.random.normal(loc=mu, scale=sigma, size=100)
#下面代码与上买你代码等价
#mu, sigma = 100, 4
#data = stats.norm(mu, sigma).rvs(1000)
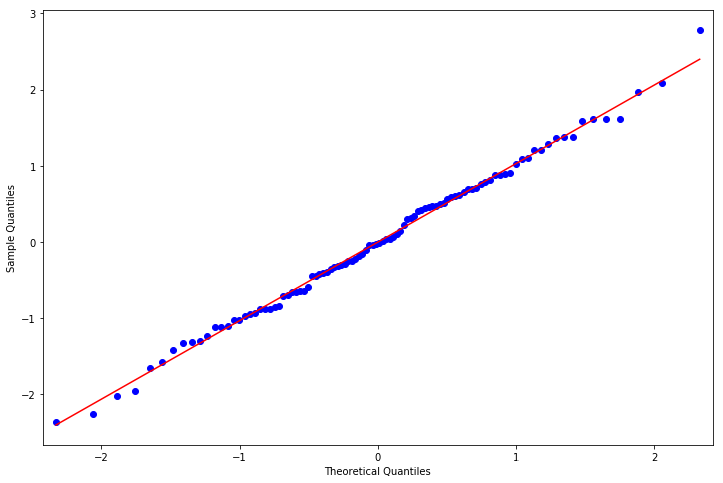
# 画QQ图
fig = plt.figure(figsize=(12,8))
ax = fig.add_subplot(111)
fig = qqplot(data, line='q', ax=ax, fit=True)
点都依附在直线附近,所以为高斯分布
另外的一些意义
用QQ图还可获得样本偏度和峰度的粗略信息。图形中有一段是直线,在两端存在弧度,则可说明峰度的情况。图形是曲线图,说明不对称。