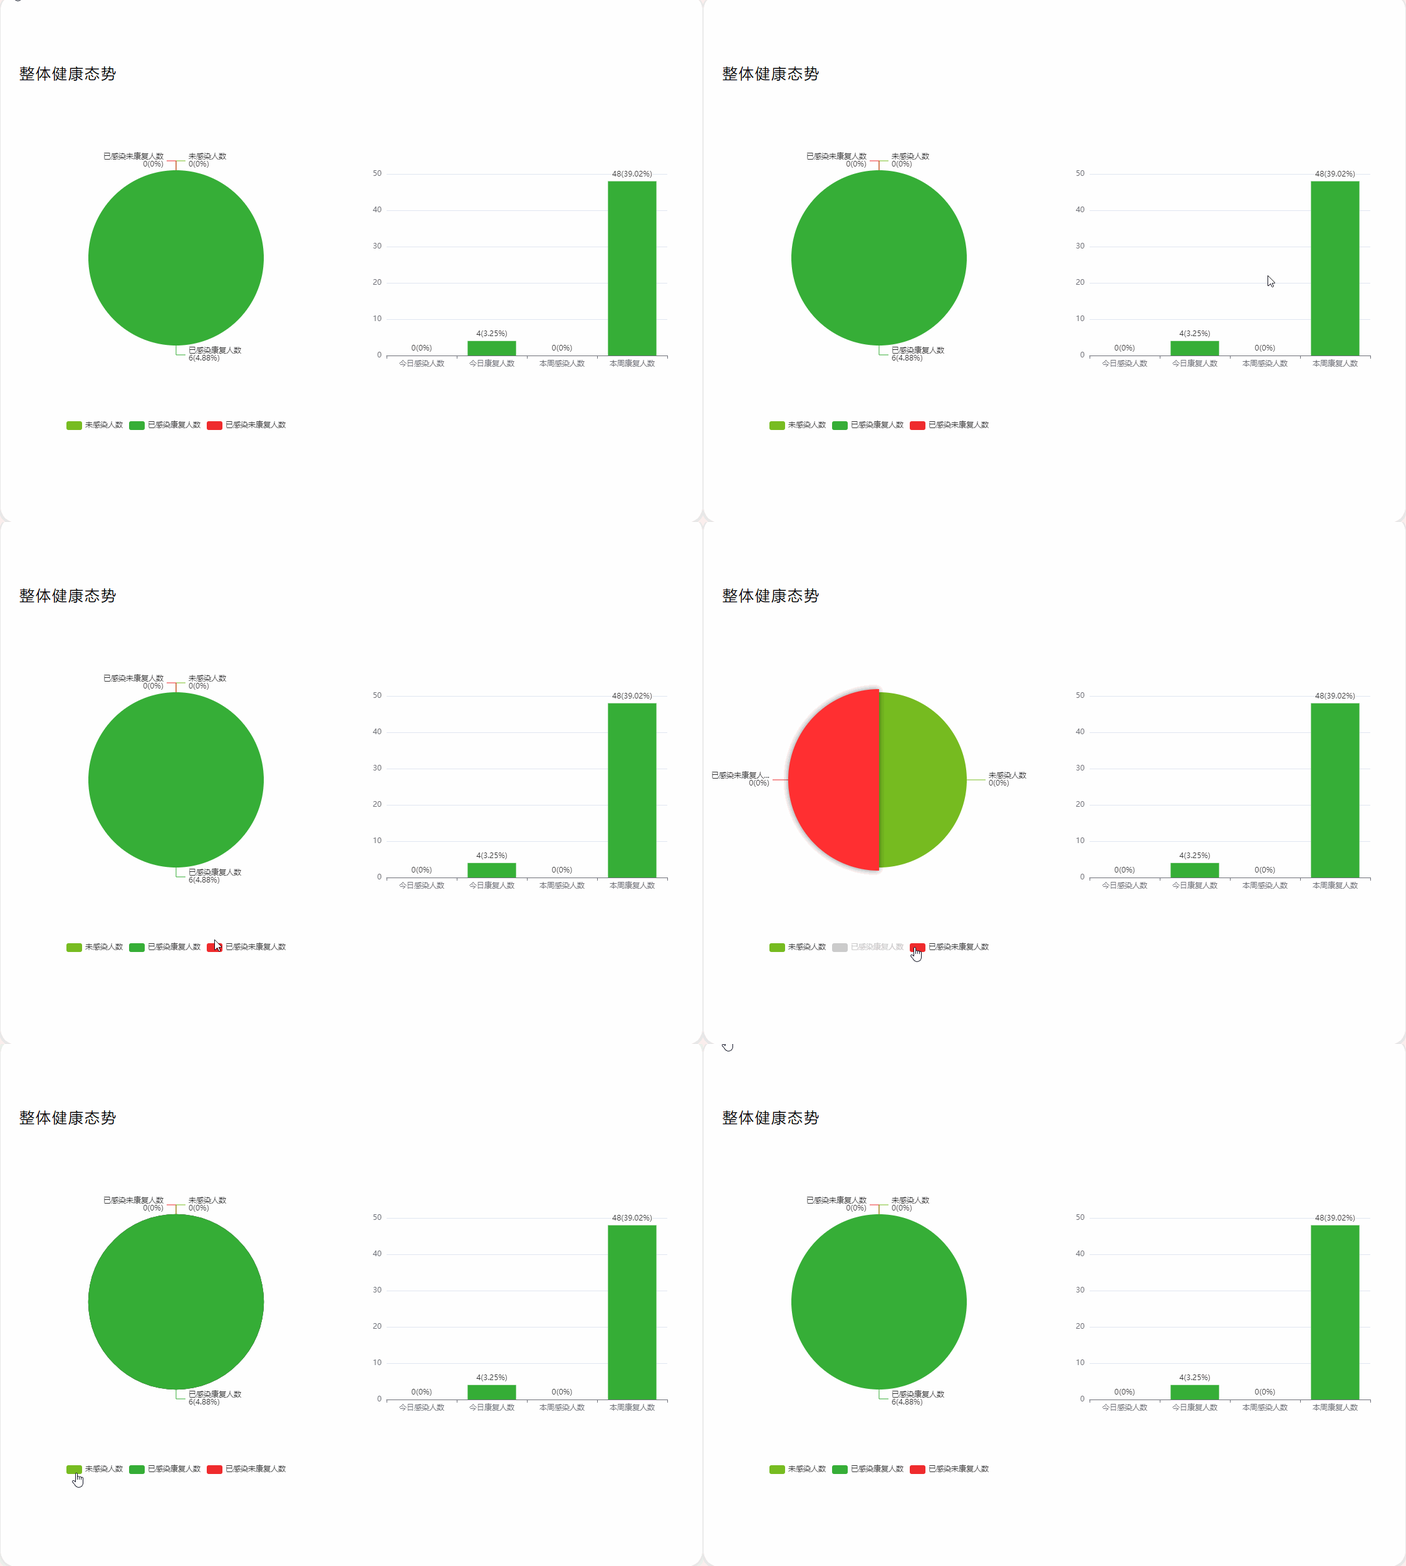
1、先展示效果图

2、直接上代码,copy代码进行调试便会懂(导入echarts插件看之前的文章)
<template>
  <div class="employee-container">
    <div class="top-content">
      <span class="top-title">整体健康态势</span>
    </div>
    <div class="statistical-chart">
      <div id="statistical-pie"></div>
      <div id="statistical-bar"></div>
    </div>
  </div>
</template>

<script>
  import {


    getAntigenRatio,
    getDayOrWeek
  } from '@/api/echartsApi'
  export default {


    name: "OverallHealthSituation",
    data() {


      return {


        pieChartBox: null,
        barChartBox: null,
        // 已康复人数
        RecoveredQty: 0,
        RecoveredRatio: 0, // 已康复人数比例
        UninfectedQty: 0, // 未感染人数
        UninfectedRatio: 0, // 未感染人数比例
        UnrecoverableQty: 0, // 已感染未康复人数
        UnrecoverableRatio: 0, // 已感染未康复人数比例
        dayInfectedQty: 0, // 今日感染人数
        dayInfectedRatio: 0, // 今日感染人数比例
        dayRecoveryQty: 0, // 今日康复人数
        dayRecoveryRatio: 0, // 今日康复人数比例
        weekInfectedQty: 0, // 本周感染人数比例
        weekInfectedRatio: 0, // 本周感染人数比例
        weekRecoveryQty: 0, // 本周康复人数比例
        weekRecoveryRatio: 0, // 本周康复人数比例
      };
    },
    created() {


      this.getData()
    },
    mounted() {


      setTimeout(() => {


        this.pieEchart()
        this.barEchart()
      }, 500);
    },

    methods: {


      getData() {


        // 饼图数据
        getAntigenRatio().then(res => {


          this.RecoveredQty = res.data.RecoveredQty
          this.RecoveredRatio = res.data.RecoveredRatio
          this.UninfectedQty = res.data.UninfectedQty
          this.UninfectedRatio = res.data.UninfectedRatio
          this.UnrecoverableQty = res.data.UnrecoverableQty
          this.UnrecoverableRatio = res.data.UnrecoverableRatio
        })
        // 柱形图数据
        getDayOrWeek().then(res => {


          res.data.forEach(item => {


            if (item.typeDescription == '天') {


              this.dayInfectedQty = item.infectedQty, // 今日感染人数
                this.dayInfectedRatio = item.infectedRatio, // 今日感染人数比例
                this.dayRecoveryQty = item.recoveryQty, // 今日康复人数
                this.dayRecoveryRatio = item.recoveryRatio // 今日康复人数比例
            } else if (item.typeDescription == '周') {


              this.weekInfectedQty = item.infectedQty, // 本周感染人数比例
                this.weekInfectedRatio = item.infectedRatio, // 本周感染人数比例
                this.weekRecoveryQty = item.recoveryQty, // 本周康复人数比例
                this.weekRecoveryRatio = item.recoveryRatio // 本周康复人数比例
            }
          });
        })
      },
      // 1、 饼图echart图表
      pieEchart() {


        let UninfectedRatio = this.UninfectedRatio
        let RecoveredRatio = this.RecoveredRatio
        let UnrecoverableRatio = this.UnrecoverableRatio
        if (this.pieChartBox != null && this.pieChartBox != "" && this.pieChartBox != undefined) {


          this.pieChartBox.dispose() //销毁
        }
        this.pieChartBox = this.$echarts.init(document.getElementById("statistical-pie"));
        const option = {


          tooltip: {


            trigger: 'item'
          },
          legend: {


            orient: 'vertical',
            bottom: 'bottom',
            // data: ['未感染人数', '已感染康复人数', '已感染未康复人数']
          },
          color: ['#77bc21', '#36ae37', '#ef2b2d'],
          series: [{


            name: '统计图',
            type: 'pie',
            radius: '50%',
            data: [{


                value: this.UninfectedQty,
                name: '未感染人数',
                label: {


                  show: true,
                  position: 'top',
                  formatter: function (val) {


                    // if (val.value == 0) {


                    //   return ""
                    // }
                    let proportion = '未感染人数\n' + val.value + '(' + UninfectedRatio + '%' + ')'
                    return proportion
                  },
                }
              },
              {


                value: this.RecoveredQty,
                name: '已感染康复人数',
                label: {


                  show: true,
                  position: 'top',
                  formatter: function (val) {


                    // if (val.value == 0) {


                    //   return ""
                    // }
                    let proportion = '已感染康复人数\n' + val.value + '(' + RecoveredRatio + '%' + ')'
                    return proportion
                  },
                }
              },
              {


                value: this.UnrecoverableQty,
                name: '已感染未康复人数',
                label: {


                  show: true,
                  position: 'top',
                  formatter: function (val) {


                    // if (val.value == 0) {


                    //   return ""
                    // }
                    let proportion = '已感染未康复人数\n' + val.value + '(' + UnrecoverableRatio + '%' + ')'
                    return proportion
                  },
                }
              },
            ],
            emphasis: {


              itemStyle: {


                shadowBlur: 10,
                shadowOffsetX: 0,
                shadowColor: 'rgba(0, 0, 0, 0.5)'
              }
            }
          }]
        };
        this.pieChartBox.setOption(option);
        // 根据页面大小自动响应图表大小
        // window.addEventListener("resize", function () {


        //   this.pieChartBox.resize();
        // });
      },
      // 2、柱形图echarts图表
      barEchart() {


        let dayInfectedQty = this.dayInfectedQty // 今日感染人数
        let dayInfectedRatio = this.dayInfectedRatio // 今日感染人数比例
        let dayRecoveryQty = this.dayRecoveryQty // 今日康复人数
        let dayRecoveryRatio = this.dayRecoveryRatio // 今日康复人数比例
        let weekInfectedQty = this.weekInfectedQty // 本周感染人数比例
        let weekInfectedRatio = this.weekInfectedRatio // 本周感染人数比例
        let weekRecoveryQty = this.weekRecoveryQty // 本周康复人数比例
        let weekRecoveryRatio = this.weekRecoveryRatio // 本周康复人数比例
        if (this.barChartBox != null && this.barChartBox != "" && this.barChartBox != undefined) {


          this.barChartBox.dispose() //销毁
        }
        this.barChartBox = this.$echarts.init(document.getElementById("statistical-bar"));
        const option = {


          xAxis: {


            type: 'category',
            data: ['今日感染人数', '今日康复人数', '本周感染人数', '本周康复人数']
          },
          yAxis: {


            type: 'value'
          },

          series: [{


            data: [{


              value: dayInfectedQty,
              itemStyle: {


                color: '#ef2b2d'
              },
              label: {


                show: true,
                position: 'top',
                formatter: function (val) {


                  // if (val.value == 0) {


                  //   return ""
                  // }
                  let proportion = val.value + '(' + dayInfectedRatio + '%' + ')'
                  return proportion
                },
              }
            }, {


              value: dayRecoveryQty,
              itemStyle: {


                color: '#36ae37'
              },
              label: {


                show: true,
                position: 'top',
                formatter: function (val) {


                  // if (val.value == 0) {


                  //   return ""
                  // }
                  let proportion = val.value + '(' + dayRecoveryRatio + '%' + ')'
                  return proportion
                },
              }

            }, {


              value: weekInfectedQty,
              itemStyle: {


                color: '#ef2b2d'
              },
              label: {


                show: true,
                position: 'top',
                formatter: function (val) {


                  // if (val.value == 0) {


                  //   return ""
                  // }
                  let proportion = val.value + '(' + weekInfectedRatio + '%' + ')'
                  return proportion
                },
              }
            }, {


              value: weekRecoveryQty,
              itemStyle: {


                color: '#36ae37'
              },
              label: {


                show: true,
                position: 'top',
                formatter: function (val) {


                  // if (val.value == 0) {


                  //   return ""
                  // }
                  let proportion = val.value + '(' + weekRecoveryRatio + '%' + ')'
                  return proportion
                },
              }
            }],
            type: 'bar'
          }]
        };
        this.barChartBox.setOption(option);
        // 根据页面大小自动响应图表大小
        // window.addEventListener("resize", function () {


        //   this.barChartBox.resize();
        // });
      },
    },
  };
</script>

<style lang="scss" scoped>
  .employee-container {


    width: 100%;
    height: 100%;
    padding-top: 20px;
    display: flex;
    flex-direction: column;
    align-items: center;

    .top-content {


      width: 100%;
      display: flex;

      .top-title {


        font-size: 24px;
        letter-spacing: 2px;
        margin-left: 30px;
      }
    }

    .statistical-chart {


      display: flex;
      justify-content: space-between;
      // align-items: center;
      width: 1120px;
      height: 700px;

      #statistical-pie {


        width: 560px;
        height: 560px;
      }

      #statistical-bar {


        margin-top: 86px;
        width: 560px;
        height: 420px;
      }
    }

  }
</style>