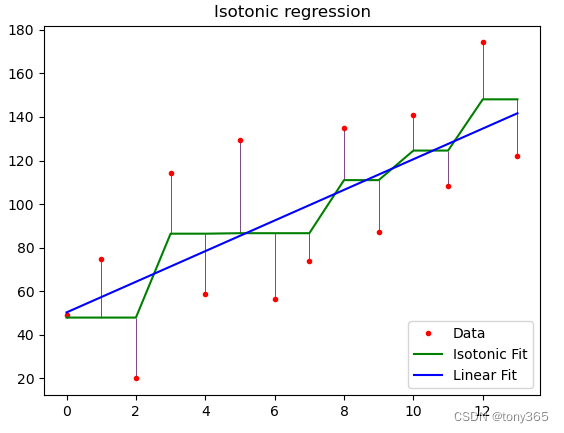
python code
import numpy as np
import matplotlib.pyplot as plt
from matplotlib.collections import LineCollection

from sklearn.linear_model import LinearRegression
from sklearn.isotonic import IsotonicRegression
from sklearn.utils import check_random_state


if __name__ == "__main__":
    n = 14
    x = np.arange(n)
    rs = check_random_state(20)
    y = rs.randint(-50, 50, size=(n,)) + 50. * np.log1p(np.arange(n))

    # #############################################################################
    #拟合等渗回归和线性回归模型

    ir = IsotonicRegression()

    y_ = ir.fit_transform(x, y)

    lr = LinearRegression()
    lr.fit(x[:, np.newaxis], y)  #对线性回归而言X需要时二维的

    # #############################################################################
    # 绘制结果

    segments = [[[i, y[i]], [i, y_[i]]] for i in range(n)]
    lc = LineCollection(segments, zorder=0)
    lc.set_array(np.ones(len(y)))
    lc.set_linewidths(np.full(n, 0.5))

    fig = plt.figure()
    plt.plot(x, y, 'r.', markersize=6)
    plt.plot(x, y_, 'g-')
    plt.plot(x, lr.predict(x[:, np.newaxis]), 'b-')
    plt.gca().add_collection(lc)
    plt.legend(('Data', 'Isotonic Fit', 'Linear Fit'), loc='lower right')
    plt.title('Isotonic regression')
    plt.show()
    print(y)
    print(y_)