一、实验目的
构建多层神经网络模型,对MNIST手写体数字进行识别,尝试采用不同超参数对模型进行训练,使模型最终的识别准确率能达到95%以上。
二、算法步骤
1.解析与加载数据
(1)从文件夹打开并读取已下载的MNIST数据集。
(2)调用load_mnist函数加载6000个训练实例和10000个测试样本。
load_mnist函数将返回两个阵列,第一个images是nm维的NumPy阵列,其中n为样本数,m为特征数(图片像素),数据集每个图像由28×28像素组成,把28×28的像素展开变成一维行向量,代表image阵列的行(784个行或图像)。函数返回的第二个阵列labels,包含相应的目标变量、手写数字分类标签。
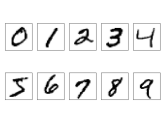
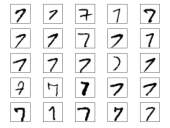
(3)调用Matplotlib的inshow函数把拥有784个像素的向量特征矩阵变换回原来的2828像素。将数字0~9按2行5列的格式图示出来;将数字7的前25种变体按5行5列的格式图示出来;
(4)由mnist对象把训练集和测试集读取到变量中。
2.建立人工网络模型并实现数据处理:
(1)构建双隐层人工神经网络分类器模型。每层分别有100和50个神经节点,根据训练集数据训练模型,并读入测试集的样本进行测试结果分析。
mlp = MLPClassifier(hidden_layer_sizes=(100, 50), max_iter=200)
mlp.fit(X_train, y_train) # 训练
predictions = mlp.predict(X_test) # 测试
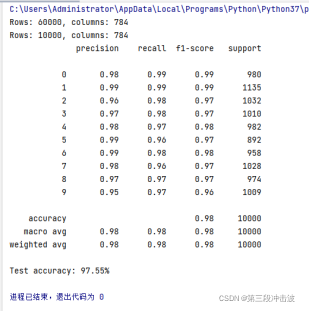
(2)数据分析。打印出各输出类别的识别精度、准确率和样本数量,打印出整体数据集的识别准确率。
三、直接上代码
# coding: utf-8
import sys
import gzip
import shutil
import os
import struct
import numpy as np
import matplotlib.pyplot as plt

from sklearn.neural_network import MLPClassifier
from sklearn.datasets import load_digits
from sklearn.model_selection import train_test_split
from sklearn.metrics import classification_report
import matplotlib.pyplot as plt

if (sys.version_info > (3, 0)):
    writemode = 'wb'
else:
    writemode = 'w'

zipped_mnist = [f for f in os.listdir('./') if f.endswith('ubyte.gz')]
for z in zipped_mnist:
    with gzip.GzipFile(z, mode='rb') as decompressed, open(z[:-3], writemode) as outfile:
        outfile.write(decompressed.read())

def load_mnist(path, kind='train'):
    """Load MNIST data from `path`"""
    labels_path = os.path.join(path,
                               '%s-labels-idx1-ubyte' % kind)
    images_path = os.path.join(path,
                               '%s-images-idx3-ubyte' % kind)

    with open(labels_path, 'rb') as lbpath:
        magic, n = struct.unpack('>II',
                                 lbpath.read(8))
        labels = np.fromfile(lbpath,
                             dtype=np.uint8)

    with open(images_path, 'rb') as imgpath:
        magic, num, rows, cols = struct.unpack(">IIII",
                                               imgpath.read(16))
        images = np.fromfile(imgpath,
                             dtype=np.uint8).reshape(len(labels), 784)
        images = ((images / 255.) - .5) * 2

    return images, labels


X_train, y_train = load_mnist('', kind='train')
print('Rows: %d, columns: %d' % (X_train.shape[0], X_train.shape[1]))

X_test, y_test = load_mnist('', kind='t10k')
print('Rows: %d, columns: %d' % (X_test.shape[0], X_test.shape[1]))

# Visualize the first digit of each class:


fig, ax = plt.subplots(nrows=2, ncols=5, sharex=True, sharey=True, )
ax = ax.flatten()
for i in range(10):
    img = X_train[y_train == i][0].reshape(28, 28)
    ax[i].imshow(img, cmap='Greys')

ax[0].set_xticks([])
ax[0].set_yticks([])
plt.tight_layout()
# plt.savefig('images/12_5.png', dpi=300)
plt.show()

# Visualize 25 different versions of "7":


fig, ax = plt.subplots(nrows=5, ncols=5, sharex=True, sharey=True, )
ax = ax.flatten()
for i in range(25):
    img = X_train[y_train == 7][i].reshape(28, 28)
    ax[i].imshow(img, cmap='Greys')

ax[0].set_xticks([])
ax[0].set_yticks([])
plt.tight_layout()
# plt.savefig('images/12_6.png', dpi=300)
plt.show()

np.savez_compressed('mnist_scaled.npz',
                    X_train=X_train,
                    y_train=y_train,
                    X_test=X_test,
                    y_test=y_test)

mnist = np.load('mnist_scaled.npz')
mnist.files

X_train, y_train, X_test, y_test = [mnist[f] for f in ['X_train', 'y_train',
                                                       'X_test', 'y_test']]

del mnist

X_train.shape


mlp = MLPClassifier(hidden_layer_sizes=(100, 50), max_iter=200)
mlp.fit(X_train, y_train)

predictions = mlp.predict(X_test)
print(classification_report(y_test, predictions))


y_test_pred = mlp.predict(X_test)
acc = (np.sum(y_test == y_test_pred)
       .astype(np.float) / X_test.shape[0])

print('Test accuracy: %.2f%%' % (acc * 100))

miscl_img = X_test[y_test != y_test_pred][:25]
correct_lab = y_test[y_test != y_test_pred][:25]
miscl_lab = y_test_pred[y_test != y_test_pred][:25]

fig, ax = plt.subplots(nrows=5, ncols=5, sharex=True, sharey=True, )
ax = ax.flatten()
for i in range(25):
    img = miscl_img[i].reshape(28, 28)
    ax[i].imshow(img, cmap='Greys', interpolation='nearest')
    ax[i].set_title('%d) t: %d p: %d' % (i + 1, correct_lab[i], miscl_lab[i]))

ax[0].set_xticks([])
ax[0].set_yticks([])
plt.tight_layout()

plt.show()
四、实验结果
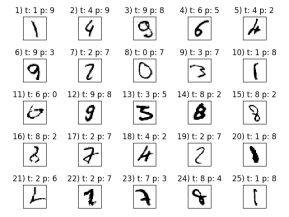
4张图片依次为:10种输出类别; 数字7的前25种变体; 测试数据中前25张手写体图片及识别结果; 实验结果数据分析。