【论文阅读】A Gentle Introduction to Graph Neural Networks [图神经网络入门](2)
Graphs and where to find them
图以及在哪里找图
You’re probably already familiar with some types of graph data, such as social networks. However, graphs are an extremely powerful and general representation of data, we will show two types of data that you might not think could be modeled as graphs: images and text. Although counterintuitive, one can learn more about the symmetries and structure of images and text by viewing them as graphs, and build an intuition that will help understand other less grid-like graph data, which we will discuss later.
你可能已经熟悉了某些类型的图数据,例如社交网络。然而,图是一种非常强大并且普遍的数据表示类型,我们将展示两种你可能认为它们无法建模为图的类型的数据: 图像和文本。尽管有悖直觉,但通过将图像和文本视为图,可以了解更多关于它们的对称性和结构的信息,并建立一种概念,有助于理解其他不太像网格的图数据,我们将在后面讨论。
注: 这里的图像和图是区分开的,图像是指图片或者相片,而这里的图是指图结构。
Images as graphs
图像类型的图
We typically think of images as rectangular grids with image channels, representing them as arrays (e.g., 244 × 244 × 3 244×244×3 244×244×3 floats). Another way to think of images is as graphs with regular structure, where each pixel represents a node and is connected via an edge to adjacent pixels. Each non-border pixel has exactly 8 neighbors, and the information stored at each node is a 3-dimensional vector representing the RGB value of the pixel.
我们通常认为图像是带有图像通道的矩形网格,用数组表示它们(例如, 244 × 244 × 3 244×244×3 244×244×3 浮点数)。另一种将图像看作具有规则结构的图,其中每个像素代表一个节点,并通过一条边与相邻像素连接。每个无边界像素正好有8个邻居,每个节点上存储的信息是表示像素RGB值的三维向量。
A way of visualizing the connectivity of a graph is through its adjacency matrix. We order the nodes, in this case each of 25 pixels in a simple 5 × 5 5×5 5×5 image of a smiley face, and fill a matrix of n n o d e s × n n o d e s n_{nodes}×n_{nodes} nnodes×nnodes with an entry if two nodes share an edge. Note that each of these three representations below are different views of the same piece of data.
可视化图的连通性的一种方法是通过它的邻接矩阵。我们对节点进行排序,在本例中,在一个简单的 5 × 5 5×5 5×5笑脸图像中每个节点为25个像素,如果两个节点共享一条边,则用一个条目填充一个 n n o d e s × n n o d e s n_{nodes}×n_{nodes} nnodes×nnodes的矩阵。请注意,下面这三种表示都是同一图数据的不同视图。

如上图所示,第一个图为图像像素,第二个图为该图像的邻接矩阵,第三个图为该图像所对应的图(结构)。可以看到在邻接矩阵中,与像素1-1所连接的像素均被标为了蓝色,而未与像素1-1连接的像素(包括像素1-1自己)则被标为白色。
Text as graphs
文本类型的图
We can digitize text by associating indices to each character, word, or token, and representing text as a sequence of these indices. This creates a simple directed graph, where each character or index is a node and is connected via an edge to the node that follows it.
我们可以将索引关联到每个字符、单词或标记,并将文本表示为这些索引的序列,从而对文本进行数字化。这里创建了一个简单的有向图,其中每个字符或索引都是一个节点,并通过一条边连接到它后面的节点。
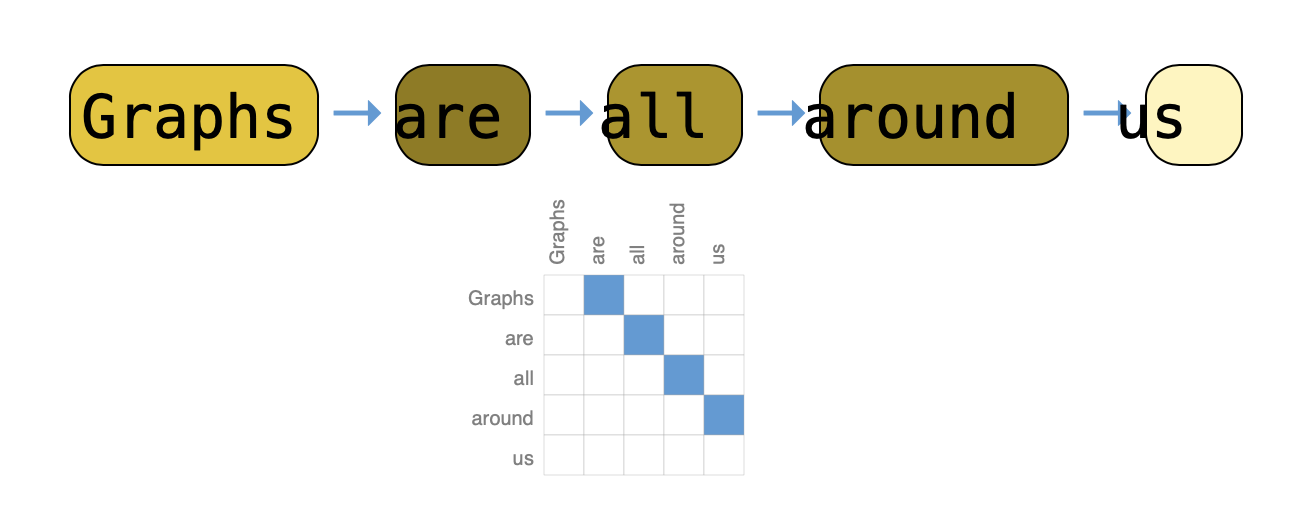
Of course, in practice, this is not usually how text and images are encoded: these graph representations are redundant since all images and all text will have very regular structures. For instance, images have a banded structure in their adjacency matrix because all nodes (pixels) are connected in a grid. The adjacency matrix for text is just a diagonal line, because each word only connects to the prior word, and to the next one.
当然,在实践中,文本和图像通常不是这样编码的: 这些图的表示是多余的,因为所有的图像和文本都有非常规则的结构。例如,图像在其邻接矩阵中有一个带状结构,因为所有节点(像素)都连接在一个网格中。文本的邻接矩阵只是一条对角线,因为每个单词只与前一个单词连接,并与下一个单词连接。
This representation (a sequence of character tokens) refers to the way text is often represented in RNNs; other models, such as Transformers, can be considered to view text as a fully connected graph where we learn the relationship between tokens. See more in Graph Attention Networks.
这种表示(字符标记序列)指的是文本通常在RNN中表示的方式;其他模型,如transformer,可以将文本视为一个完全连接的图,我们可以从中了解标记之间的关系。更多信息见图注意力网络。
Graph-valued data in the wild
特殊情况下图数据的价值
Graphs are a useful tool to describe data you might already be familiar with. Let’s move on to data which is more heterogeneously structured. In these examples, the number of neighbors to each node is variable (as opposed to the fixed neighborhood size of images and text). This data is hard to phrase in any other way besides a graph.
图是描述你可能已经熟悉的一些数据的非常有用的工具。让我们来看看结构更加特殊的数据。在这些示例中,每个节点的邻居数量是可变的(与图像和文本的邻居的固定性相反)。除了图,我们很难用其他任何方式来表达以下这示例中的数据。
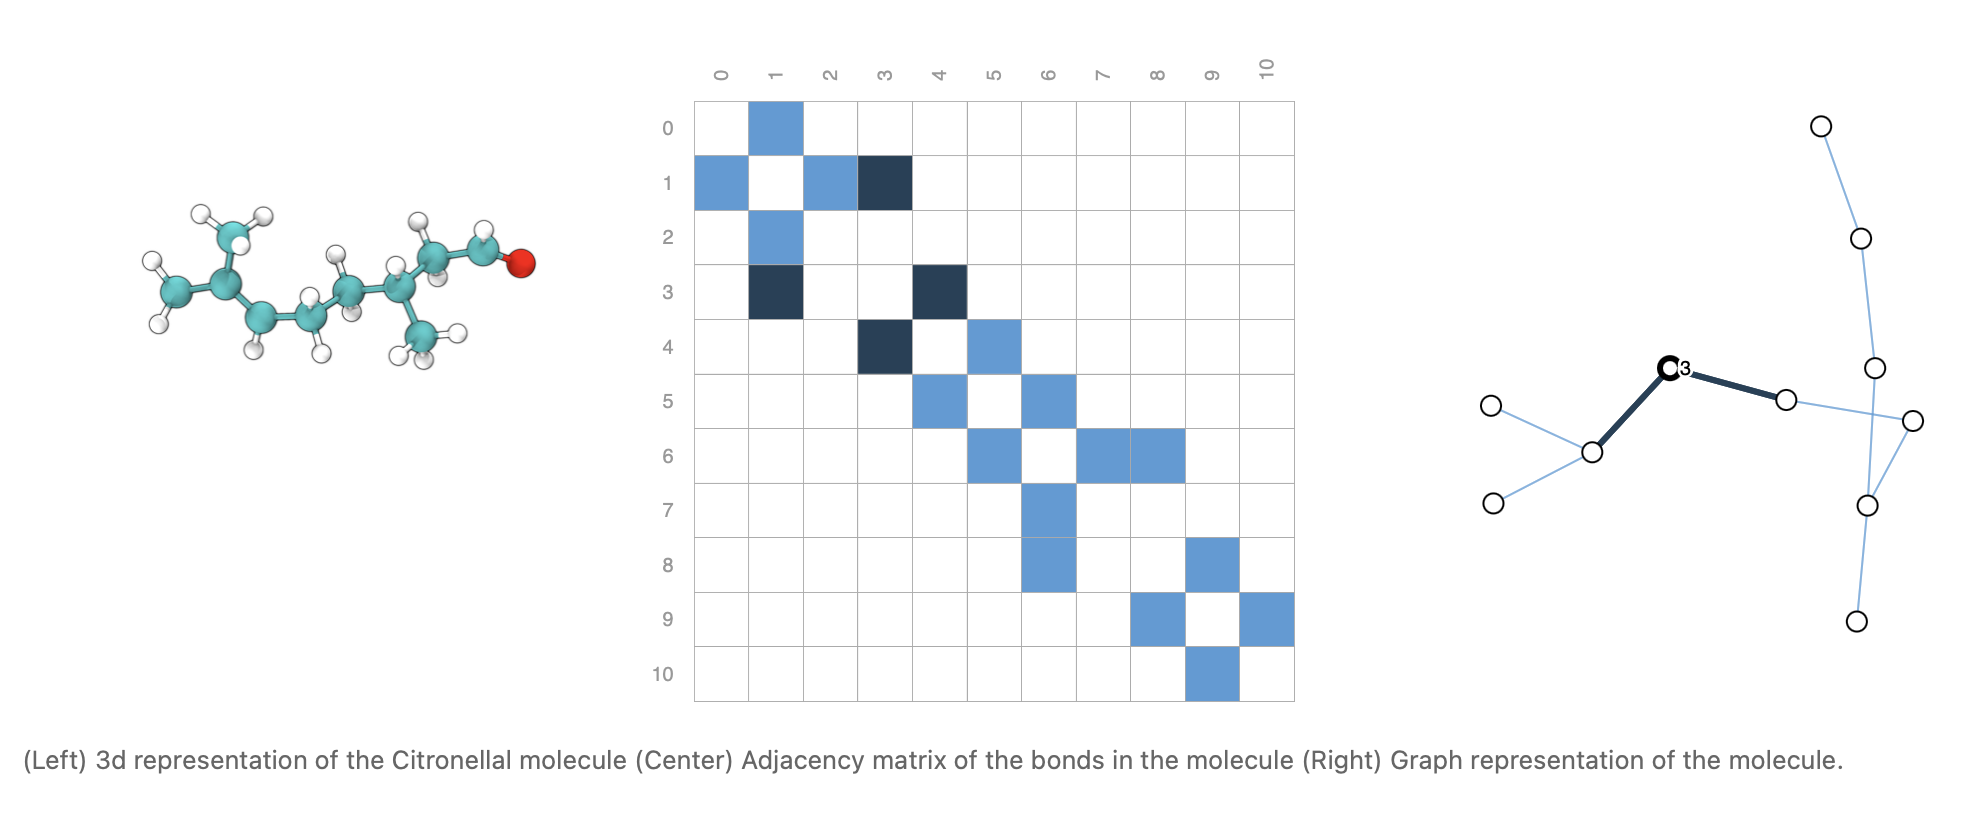
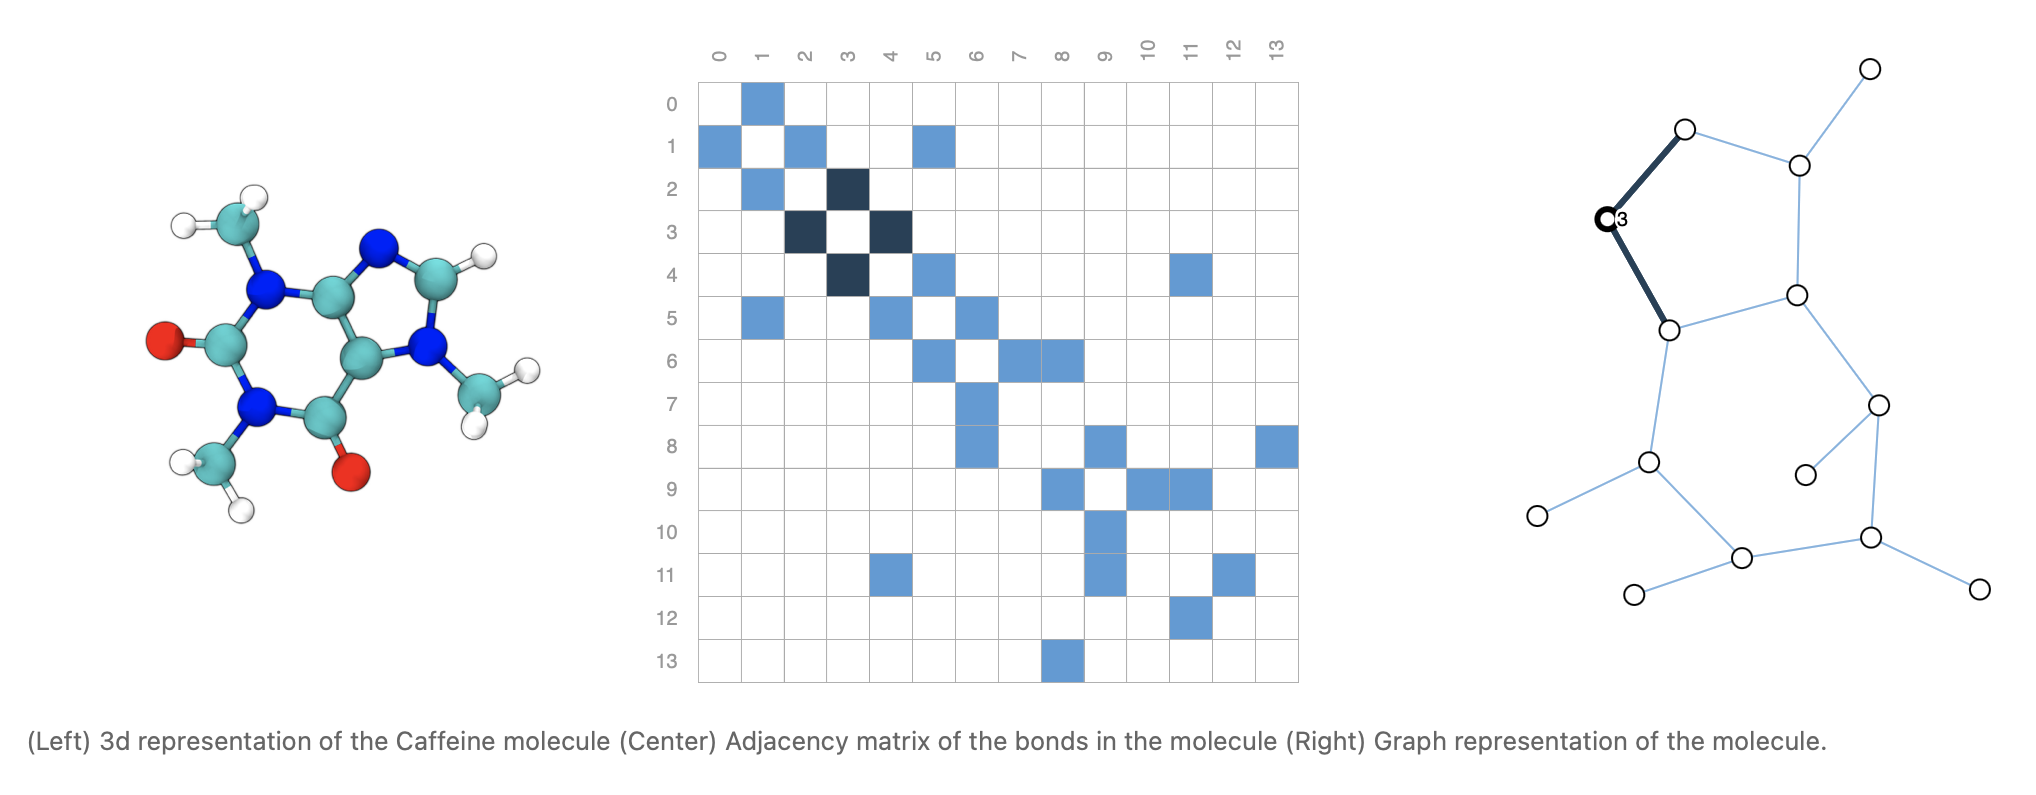
Molecules as graphs. Molecules are the building blocks of matter, and are built of atoms and electrons in 3D space. All particles are interacting, but when a pair of atoms are stuck in a stable distance from each other, we say they share a covalent bond. Different pairs of atoms and bonds have different distances (e.g. single-bonds, double-bonds). It’s a very convenient and common abstraction to describe this 3D object as a graph, where nodes are atoms and edges are covalent bonds[8]. Here are two common molecules, and their associated graphs.
分子类型的图。分子是物质的基石,是由三维空间中的原子和电子构成的。所有的粒子都在相互作用,但当一对原子彼此之间保持稳定的距离时,我们说它们共享一个共价键。不同的原子和键对有不同的距离(如单键、双键)。将这个3D对象描述为图形是一种非常方便和常见的抽象方法,其中节点是原子,边是共价键[8]。这是两种常见的分子及其相关图形。
Social networks as graphs. Social networks are tools to study patterns in collective behaviour of people, institutions and organizations. We can build a graph representing groups of people by modelling individuals as nodes, and their relationships as edges.
社交网络类型的图。社交网络是研究人们、机构和组织的集体行为模式的工具。我们可以通过将个体建模为节点,将他们的关系建模为边,来构建一个表示人群的图。
与图像和文本数据不同,社交网络没有完全相同的邻接矩阵。

Citation networks as graphs. Scientists routinely cite other scientists’ work when publishing papers. We can visualize these networks of citations as a graph, where each paper is a node, and each directed edge is a citation between one paper and another. Additionally, we can add information about each paper into each node, such as a word embedding of the abstract. (see [9], [10], [11]).
引文网络类型的图。科研工作者在发表论文时经常引用其他科研工作者的研究成果。我们可以将这些引用网络形象化为一个图,其中每一篇论文都是一个节点,每一条有向边都是一篇论文和另一篇论文之间的引用。此外,我们可以在每个节点中添加关于每篇论文的信息,例如摘要的关键词嵌入。(详见 [9], [10], [11])。
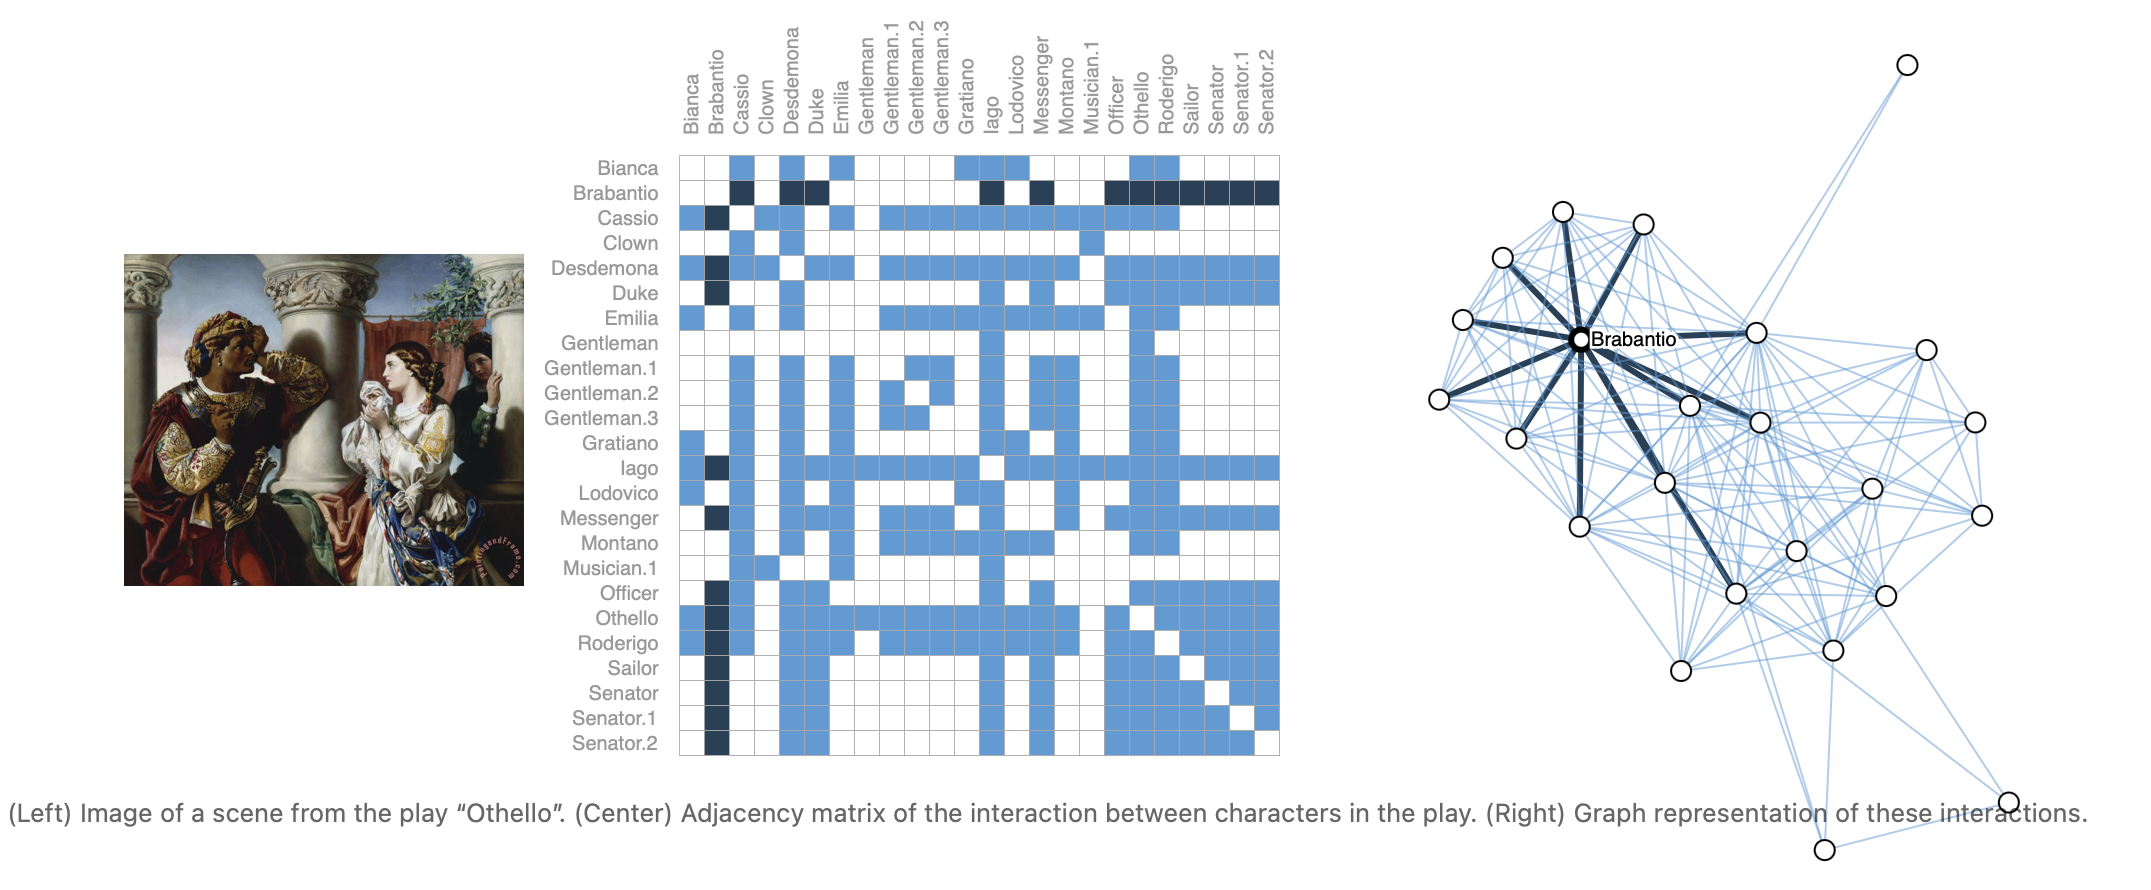
Other examples. In computer vision, we sometimes want to tag objects in visual scenes. We can then build graphs by treating these objects as nodes, and their relationships as edges. Machine learning models, programming code[12] and math equations[13] can also be phrased as graphs, where the variables are nodes, and edges are operations that have these variables as input and output. You might see the term “dataflow graph” used in some of these contexts.
其他类型的例子。在计算机视觉中,我们有时希望在视觉场景中标记对象。然后,我们可以通过将这些对象视为节点,将它们的关系视为边来构建图。机器学习模型、编程代码[12]和数学方程[13] 也可以用图来表达,其中变量是节点,边是将这些变量作为输入和输出的操作。你可能会在这些上下文中看到术语“数据流图”。
The structure of real-world graphs can vary greatly between different types of data — some graphs have many nodes with few connections between them, or vice versa. Graph datasets can vary widely (both within a given dataset, and between datasets) in terms of the number of nodes, edges, and the connectivity of nodes.
实际生活中图的结构在不同类型的数据之间可能有很大的差异——一些图有许多节点,但它们之间的连接很少,反之亦然。图数据集在节点、边的数量和节点的连接性方面可能有很大的差异(在给定的数据集内和数据集之间)。
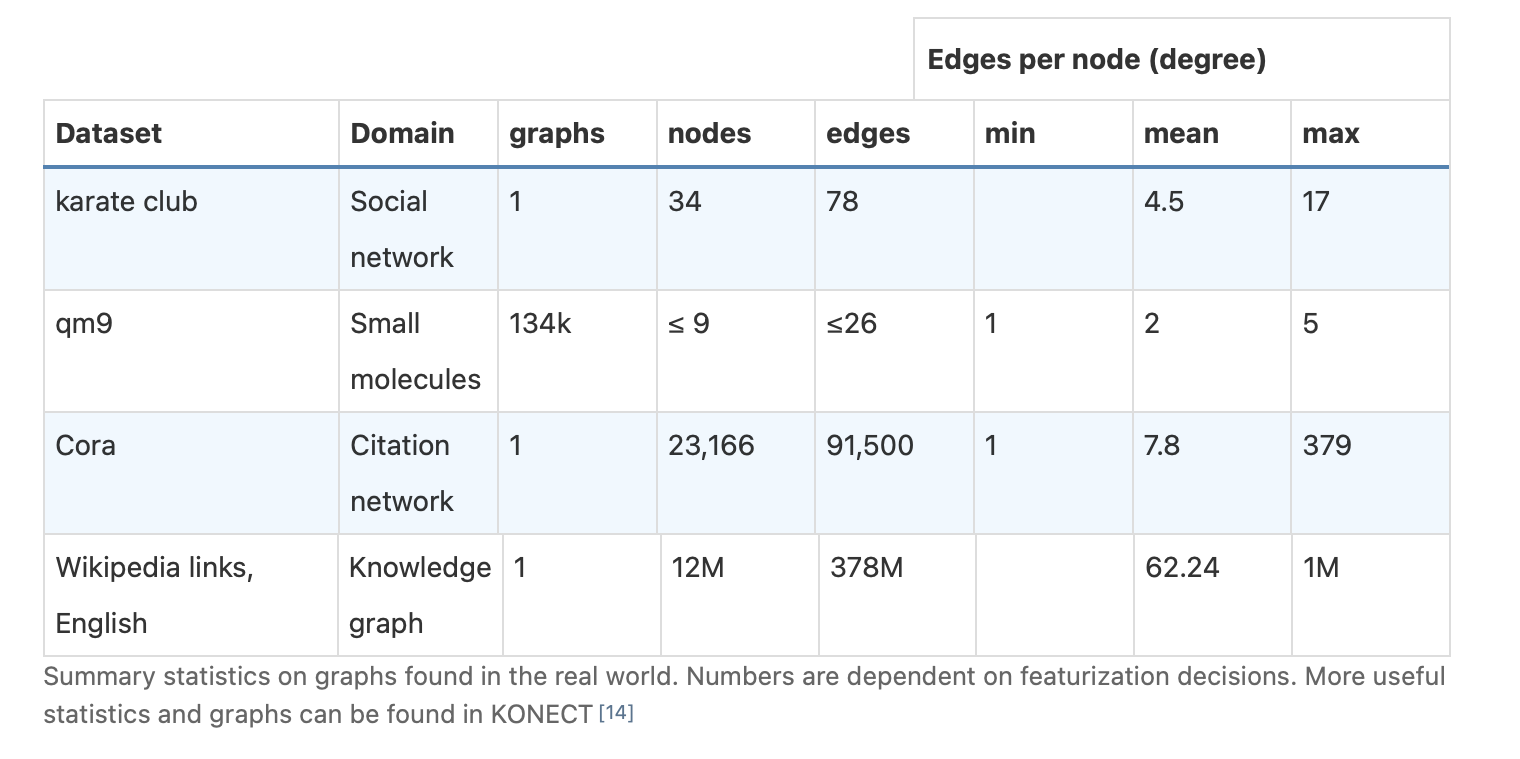 在实际生活中发现的图的汇总统计信息。数字取决于特征决策。更多有用的统计数据和图表可以在KONECT[14]中找到。
参考文献
[8] Convolutional Networks on Graphs for Learning Molecular Fingerprints Duvenaud, D., Maclaurin, D., Aguilera-Iparraguirre, J., Gomez-Bombarelli, R., Hirzel, T., Aspuru-Guzik, A. and Adams, R.P., 2015.
[9] Distributed Representations of Words and Phrases and their Compositionality Mikolov, T., Sutskever, I., Chen, K., Corrado, G. and Dean, J., 2013.
[10] BERT: Pre-training of Deep Bidirectional Transformers for Language Understanding Devlin, J., Chang, M., Lee, K. and Toutanova, K., 2018.
[11] Glove: Global Vectors for Word Representation Pennington, J., Socher, R. and Manning, C., 2014. Proceedings of the 2014 Conference on Empirical Methods in Natural Language Processing (EMNLP).
[12] Learning to Represent Programs with Graphs Allamanis, M., Brockschmidt, M. and Khademi, M., 2017.
[13] Deep Learning for Symbolic Mathematics Lample, G. and Charton, F., 2019.
[14] KONECT Kunegis, J., 2013. Proceedings of the 22nd International Conference on World Wide Web - WWW '13 Companion.