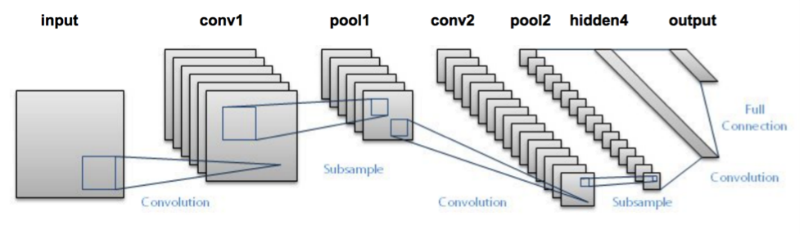
LeNet体系结构由两组卷积,激活和池化层组成,然后是一个完全连接的层,激活,另一个完全连接的层,最后是softmax分类器。 这里将使用Keras和Python(图像源)实现这种网络架构。LetNet是卷积神经网络的出色“第一个图像分类器”。 最初设计用于对手写数字进行分类,也可以轻松地将其扩展到其他类型的图像。
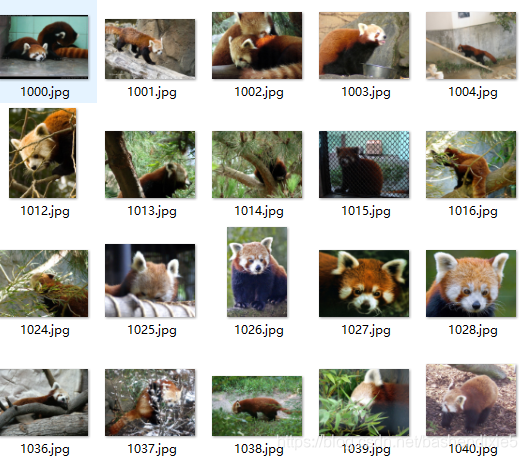
准备了120张小熊猫的图片,138张其它杂七杂八的图片。

参考代码:
from tensorflow.keras.preprocessing.image import ImageDataGenerator
from tensorflow.keras.optimizers import Adam
from sklearn.model_selection import train_test_split
from tensorflow.keras.preprocessing.image import img_to_array
from tensorflow.keras.utils import to_categorical
from tensorflow.keras.models import load_model
from imutils import paths
import matplotlib.pyplot as plt
import numpy as np
import random
import imutils
import cv2
import os
from tensorflow.keras.models import Sequential
from tensorflow.keras.layers import Conv2D
from tensorflow.keras.layers import MaxPooling2D
from tensorflow.keras.layers import Activation
from tensorflow.keras.layers import Flatten
from tensorflow.keras.layers import Dense
from tensorflow.keras import backend as K
class LeNet:
@staticmethod
def build(width, height, depth, classes):
# initialize the model
model = Sequential()
inputShape = (height, width, depth)
# if we are using "channels first", update the input shape
if K.image_data_format() == "channels_first":
inputShape = (depth, height, width)
# first set of CONV => RELU => POOL layers
model.add(Conv2D(20, (5, 5), padding="same",
input_shape=inputShape))
model.add(Activation("relu"))
model.add(MaxPooling2D(pool_size=(2, 2), strides=(2, 2)))
# second set of CONV => RELU => POOL layers
model.add(Conv2D(50, (5, 5), padding="same"))
model.add(Activation("relu"))
model.add(MaxPooling2D(pool_size=(2, 2), strides=(2, 2)))
# first (and only) set of FC => RELU layers
model.add(Flatten())
model.add(Dense(500))
model.add(Activation("relu"))
# softmax classifier
model.add(Dense(classes))
model.add(Activation("softmax"))
# return the constructed network architecture
return model
def getFileList(dir, Filelist, ext=None):
"""
获取文件夹及其子文件夹中文件列表
输入 dir:文件夹根目录
输入 ext: 扩展名
返回: 文件路径列表
"""
newDir = dir
if os.path.isfile(dir):
if ext is None:
Filelist.append(dir)
else:
if ext in dir[-3:]:
Filelist.append(dir)
elif os.path.isdir(dir):
for s in os.listdir(dir):
newDir = os.path.join(dir, s)
getFileList(newDir, Filelist, ext)
return Filelist
def train():
# initialize the number of epochs to train for, initia learning rate,
# and batch size
EPOCHS = 100
INIT_LR = 1e-3
BS = 20
# initialize the data and labels
print("[INFO] loading images...")
data = []
labels = []
imagePaths = []
paths = 'C:/Users/zyh/Desktop/f'
# grab the image paths and randomly shuffle them
imagePaths = sorted(list(getFileList(paths, imagePaths)))
random.seed(42)
random.shuffle(imagePaths)
# loop over the input images
for imagePath in imagePaths:
# load the image, pre-process it, and store it in the data list
image = cv2.imread(imagePath)
image = cv2.resize(image, (28, 28))
image = img_to_array(image)
data.append(image)
label = imagePath.split(os.path.sep)[-2]
label = 1 if label == "in" else 0
labels.append(label)
# imagePaths = []
# paths = 'C:/Users/zyh/Desktop/out'
# # grab the image paths and randomly shuffle them
# imagePaths = sorted(list(getFileList(paths, imagePaths)))
# random.seed(42)
# random.shuffle(imagePaths)
#
# # loop over the input images
# for imagePath in imagePaths:
# # load the image, pre-process it, and store it in the data list
# image = cv2.imread(imagePath)
# image = cv2.resize(image, (28, 28))
# image = img_to_array(image)
# data.append(image)
# label = 0
# labels.append(label)
# scale the raw pixel intensities to the range [0, 1]
data = np.array(data, dtype="float") / 255.0
labels = np.array(labels)
# partition the data into training and testing splits using 75% of
# the data for training and the remaining 25% for testing
(trainX, testX, trainY, testY) = train_test_split(data, labels, test_size=0.25, random_state=42)
# convert the labels from integers to vectors
trainY = to_categorical(trainY, num_classes=2)
testY = to_categorical(testY, num_classes=2)
# construct the image generator for data augmentation
aug = ImageDataGenerator(rotation_range=30, width_shift_range=0.1,
height_shift_range=0.1, shear_range=0.2, zoom_range=0.2,
horizontal_flip=True, fill_mode="nearest")
# initialize the model
print("[INFO] compiling model...")
model = LeNet.build(width=28, height=28, depth=3, classes=2)
opt = Adam(lr=INIT_LR, decay=INIT_LR / EPOCHS)
model.compile(loss="binary_crossentropy", optimizer=opt, metrics=["accuracy"])
# train the network
print("[INFO] training network...")
H = model.fit(x=aug.flow(trainX, trainY, batch_size=BS), validation_data=(testX, testY), steps_per_epoch=len(trainX) // BS, epochs=EPOCHS, verbose=1)
# save the model to disk
print("[INFO] serializing network...")
model.save('C:/Users/zyh/Desktop/simple_nn_lb.h5', save_format="h5")
# plot the training loss and accuracy
plt.style.use("ggplot")
plt.figure()
N = EPOCHS
plt.plot(np.arange(0, N), H.history["loss"], label="train_loss")
plt.plot(np.arange(0, N), H.history["val_loss"], label="val_loss")
plt.plot(np.arange(0, N), H.history["accuracy"], label="train_acc")
plt.plot(np.arange(0, N), H.history["val_accuracy"], label="val_acc")
plt.title("Training Loss and Accuracy on Red Panda/Not Red Panda")
plt.xlabel("Epoch #")
plt.ylabel("Loss/Accuracy")
plt.legend(loc="lower left")
plt.savefig('C:/Users/zyh/Desktop/simple_nn_plot.png')
def test():
# load the image
image = cv2.imread('C:/Users/zyh/Desktop/10.jpg')
orig = image.copy()
# pre-process the image for classification
image = cv2.resize(image, (28, 28))
image = image.astype("float") / 255.0
image = img_to_array(image)
image = np.expand_dims(image, axis=0)
# load the trained convolutional neural network
print("[INFO] loading network...")
model = load_model('C:/Users/zyh/Desktop/simple_nn_lb.h5')
# classify the input image
(notSanta, santa) = model.predict(image)[0]
# build the label
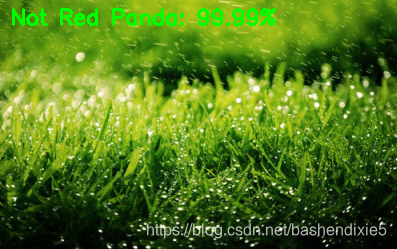
label = "Red Panda" if santa > notSanta else "Not Red Panda"
proba = santa if santa > notSanta else notSanta
label = "{}: {:.2f}%".format(label, proba * 100)
# draw the label on the image
output = imutils.resize(orig, width=400)
cv2.putText(output, label, (10, 25), cv2.FONT_HERSHEY_SIMPLEX, 0.7, (0, 255, 0), 2)
# show the output image
cv2.imshow("Output", output)
cv2.waitKey(0)
train()
#test()训练的不是特别理想,偏差还是比较大,从EPOCHS=25 尝试几次到 EPOCHS=100,得到下图的准确率和损失。

使用生成的H5模型,随便选了几张图片进行预测,结果勉强,但是中间的草地的图片达到99.99%,估计是采样的时候图片是压缩到28*28,所以这个颜色的权重可能较高。